
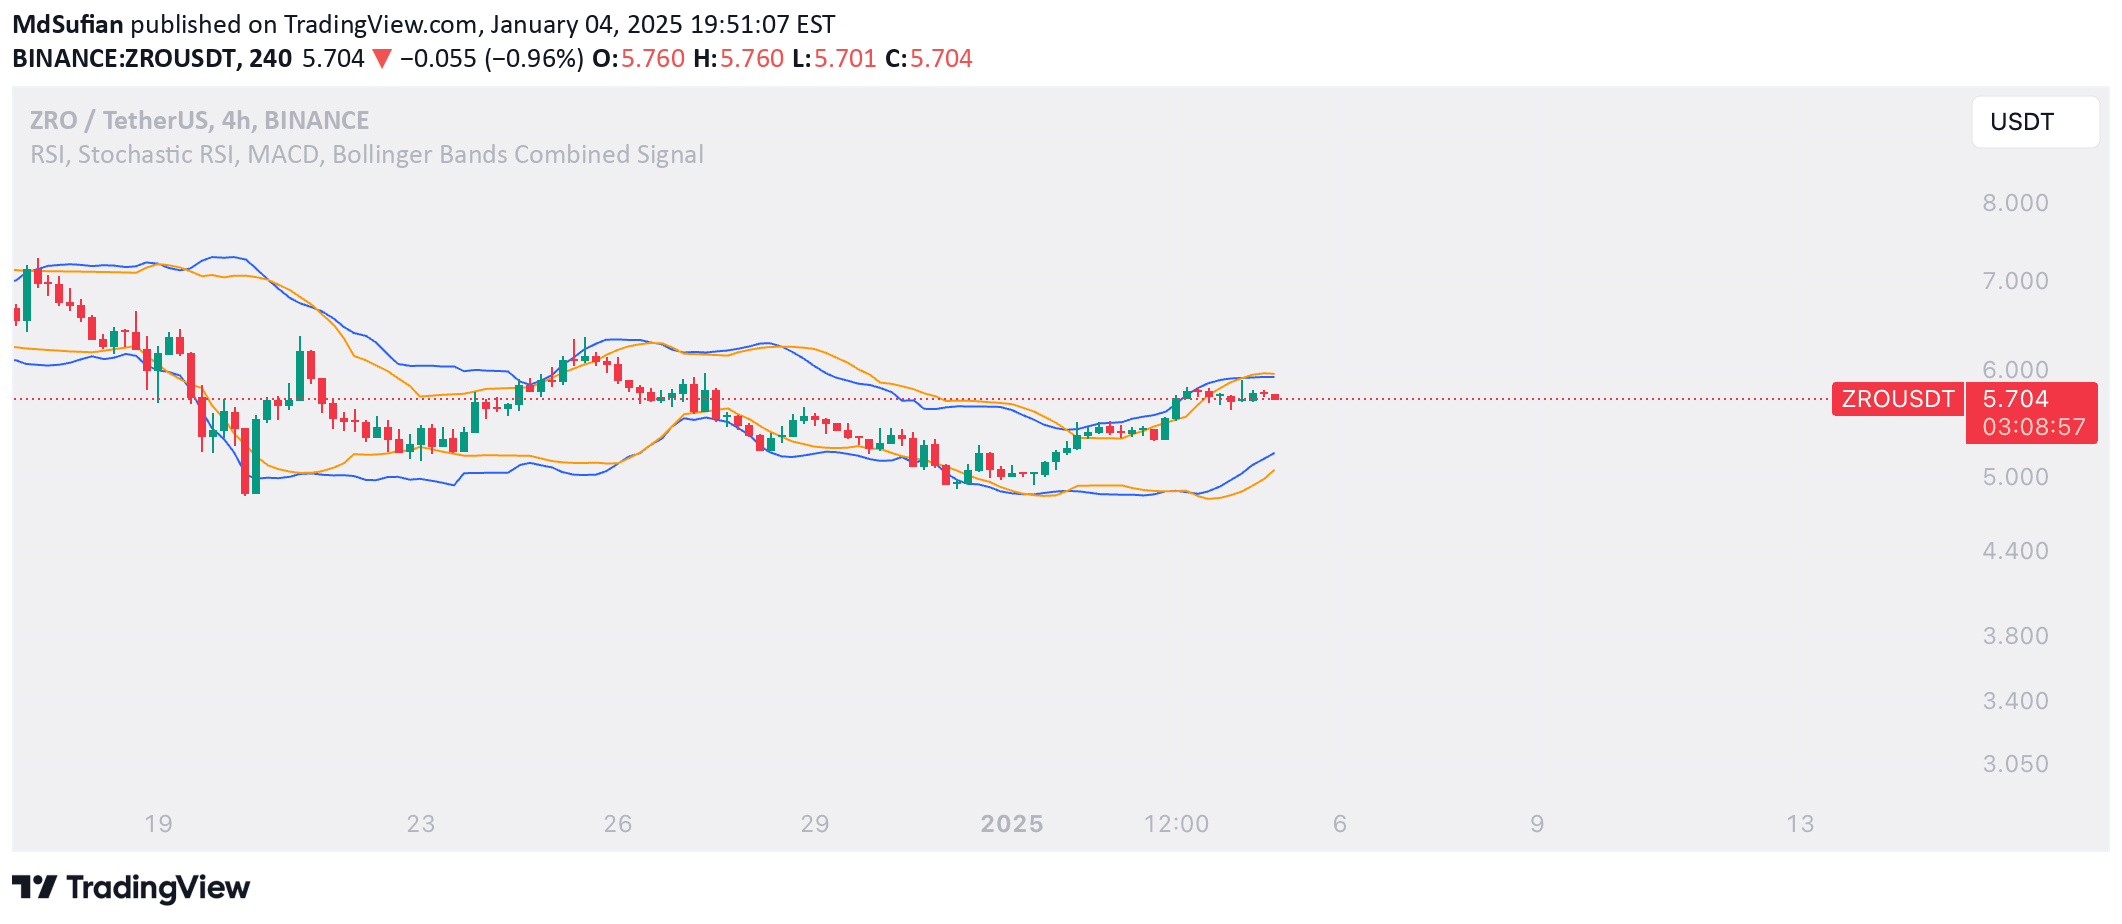
A multi-indicator trading strategy combining RSI, Stochastic RSI, MACD, and Bollinger Bands to generate precise buy and sell signals across 4-hour and daily timeframes.
Explore complementary indicator rolesHow it works
The trading signal integrates four distinct technical indicators to generate comprehensive buy and sell alerts across multiple timeframes. It first analyzes RSI and Stochastic RSI to identify oversold and overbought market conditions, examining the momentum and strength of price movements.
Simultaneously, the strategy incorporates MACD to track trend direction and Bollinger Bands to assess price volatility. By cross-referencing these indicators on both 4-hour and daily charts, the signal creates a multi-layered confirmation approach that requires all conditions to align before triggering a trade signal.
Why it may be useful
This multi-indicator strategy provides traders with a more robust and reliable method for identifying potential market entry and exit points. By combining multiple technical indicators, it reduces the likelihood of false signals and helps traders make more informed decisions based on comprehensive market analysis.
The approach offers enhanced confidence by requiring confirmation across different timeframes and indicators, which can help traders minimize risk and improve their overall trading strategy's effectiveness. It provides a systematic method for evaluating market conditions beyond relying on a single indicator's interpretation.
When to explore it
The trading signal is most effective in markets with clear trending characteristics and moderate volatility, where multiple technical indicators can provide consistent and reliable signals. It is particularly useful for traders who prefer a methodical, data-driven approach to market analysis and want to reduce emotional decision-making.
This strategy works best for day traders and swing traders who have the time to analyze multiple timeframes and can wait for comprehensive signal confirmation. It is especially valuable in markets like cryptocurrencies, forex, and liquid stock indices where technical analysis patterns are more pronounced and consistent.
Keep exploring
What we’ve verified
Access, alerts and repainting behaviour have not been independently verified for this indicator. Check the creator’s current publication and settings.
General descriptions and classifications are recovered research. Verified details above identify the specific checks we have completed. Check the creator’s current publication for later changes.


