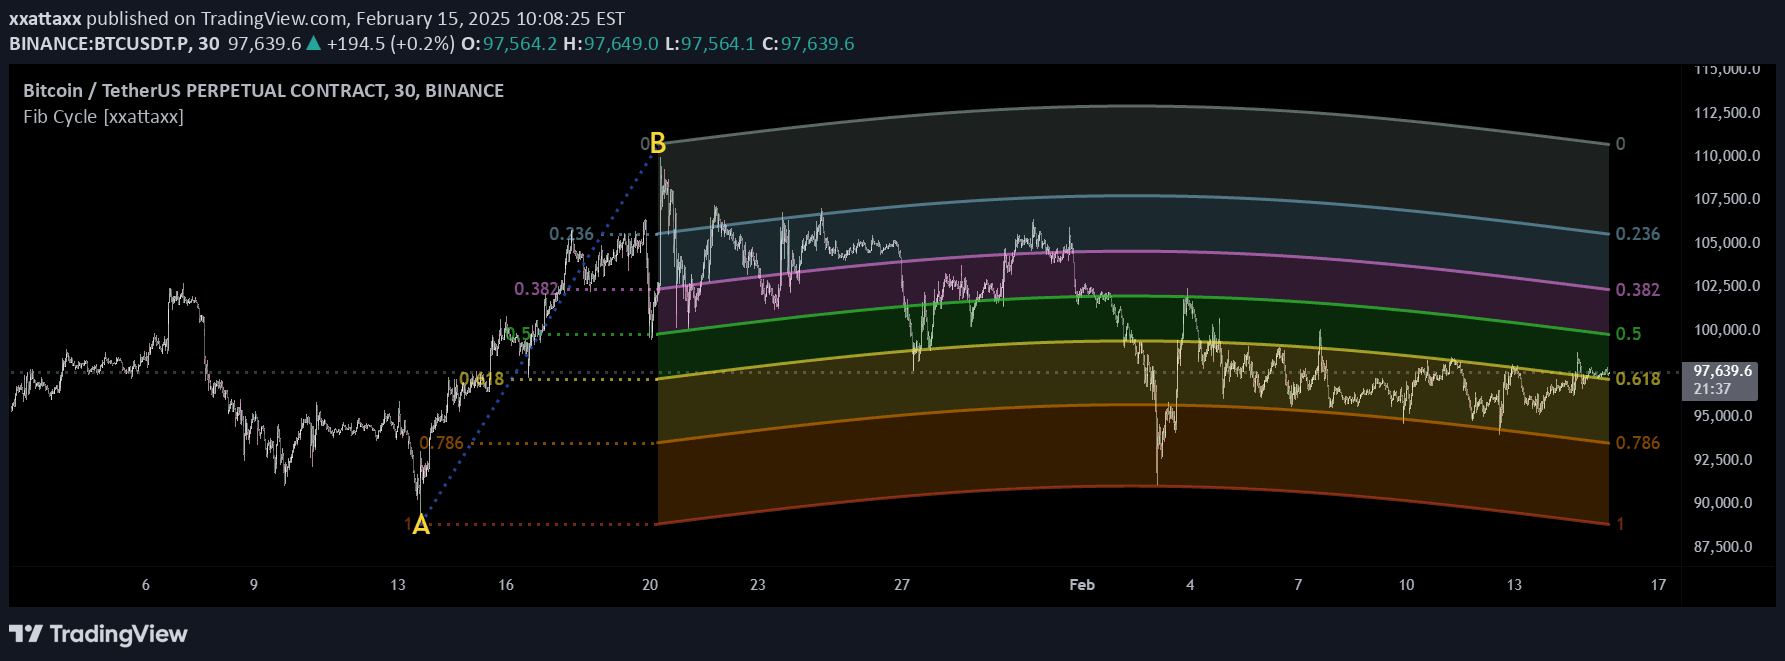
A multi-timeframe cycle analysis indicator that detects market cycles, identifying potential trend changes through low points, cycle translations, and visual confirmation across daily, weekly, and yearly timeframes.
Explore complementary indicator rolesHow it works
The indicator analyzes market cycles across three timeframes: daily (40 days), weekly (26 weeks), and yearly (4 years). It detects cycle lows by finding the lowest price point within each cycle length and confirming with bullish candles.
The algorithm calculates half-cycle lows and translates cycle positions, marking them as right (bullish) or left (bearish) translated. It also identifies cycle failures when a new low falls below the previous cycle's low
Why it may be useful
This cycle analysis provides traders with a comprehensive view of market structure and potential trend shifts. By examining multiple timeframes simultaneously, traders can gain insights into broader market dynamics beyond short-term price movements.
The visual indicators help identify potential reversal points, cycle strengths, and weaknesses. Understanding these cycle translations can improve trend identification, entry timing, and overall trading strategy precision
When to explore it
The indicator works best in markets with clear cyclical patterns, such as stocks, commodities, and forex pairs. It is most effective for swing traders and investors seeking to understand longer-term market trends.
Traders should use this tool when looking to confirm trend changes, identify potential entry and exit points, and gain a multi-timeframe perspective on market movements. It is particularly useful during trending markets and when analyzing historical price behavior
Keep exploring
What we’ve verified
Access, alerts and repainting behaviour have not been independently verified for this indicator. Check the creator’s current publication and settings.
General descriptions and classifications are recovered research. Verified details above identify the specific checks we have completed. Check the creator’s current publication for later changes.