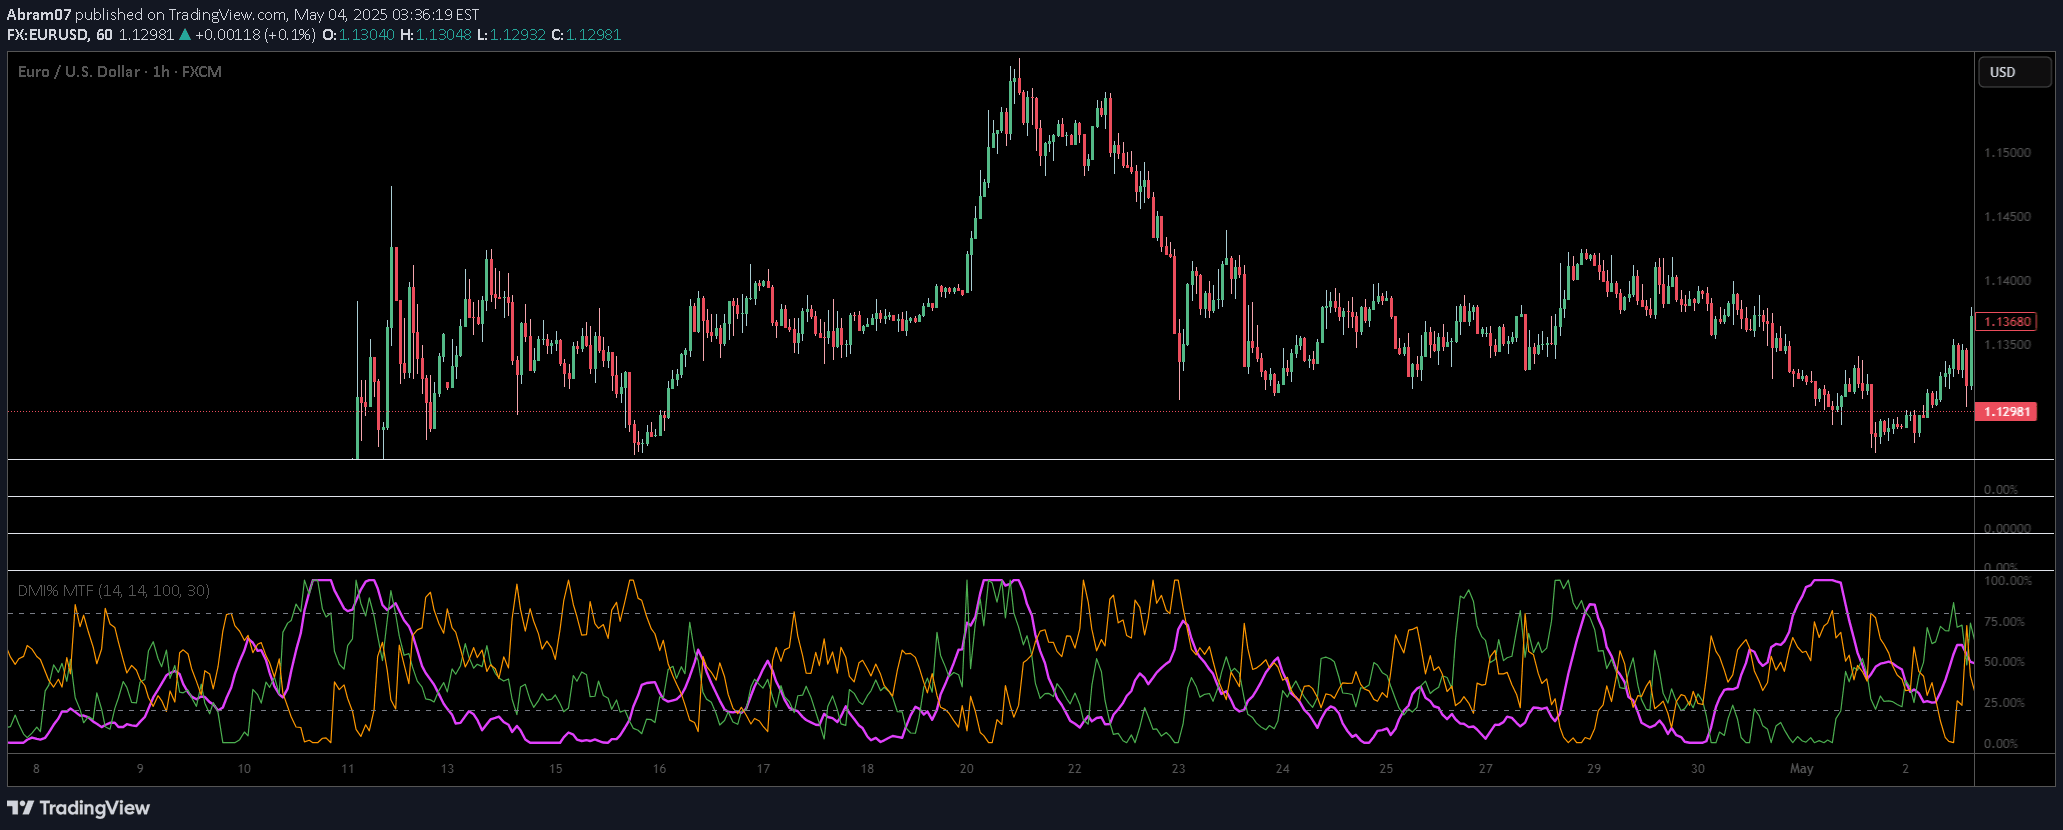
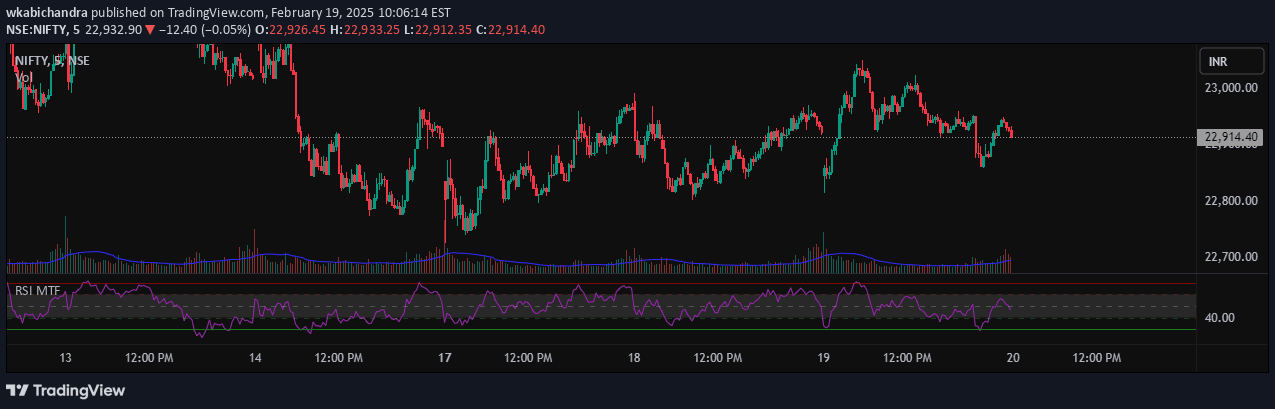
A multi-timeframe technical analysis tool that provides comprehensive ratings across five different timeframes using moving averages and oscillators to assess market sentiment.
Explore complementary indicator rolesHow it works
The Super Technical Ratings indicator analyzes market conditions by evaluating technical signals across five different timeframes: 60 minutes, 240 minutes, 1 day, 1 week, and 1 month. It calculates ratings based on a combination of moving averages and oscillators, providing a comprehensive view of market trends.
The indicator generates ratings categorized into five statuses: Strong Buy, Buy, Neutral, Sell, and Strong Sell. These ratings are visually displayed through color-coded table columns and plotted lines on the chart, with horizontal lines at 0, +0.5, and -0.5 levels to help traders quickly interpret market conditions.
Why it may be useful
This indicator simplifies complex market analysis by consolidating technical ratings across multiple timeframes into a single, easy-to-understand view. It helps traders quickly assess the overall market sentiment without the need to manually switch between different chart timeframes and perform complex technical analyses.
By providing a comprehensive overview of market conditions, the Super Technical Ratings tool enables traders to make more informed decisions. The color-coded visual representation and clear categorization of ratings make it easier to identify potential trading opportunities and understand the strength of buy or sell signals across different time periods.
When to explore it
The Super Technical Ratings indicator is most effective when traders want a quick, comprehensive view of market conditions across multiple timeframes. It is particularly useful for traders who need to assess overall market sentiment without spending extensive time analyzing individual charts and technical indicators.
This tool is especially valuable during periods of market uncertainty or when traders are looking to confirm trends across different time periods. It can help identify potential entry and exit points by providing a holistic view of technical ratings, making it a powerful tool for both day traders and swing traders seeking a broader market perspective.
Keep exploring
What we’ve verified
Access, alerts and repainting behaviour have not been independently verified for this indicator. Check the creator’s current publication and settings.
General descriptions and classifications are recovered research. Verified details above identify the specific checks we have completed. Check the creator’s current publication for later changes.