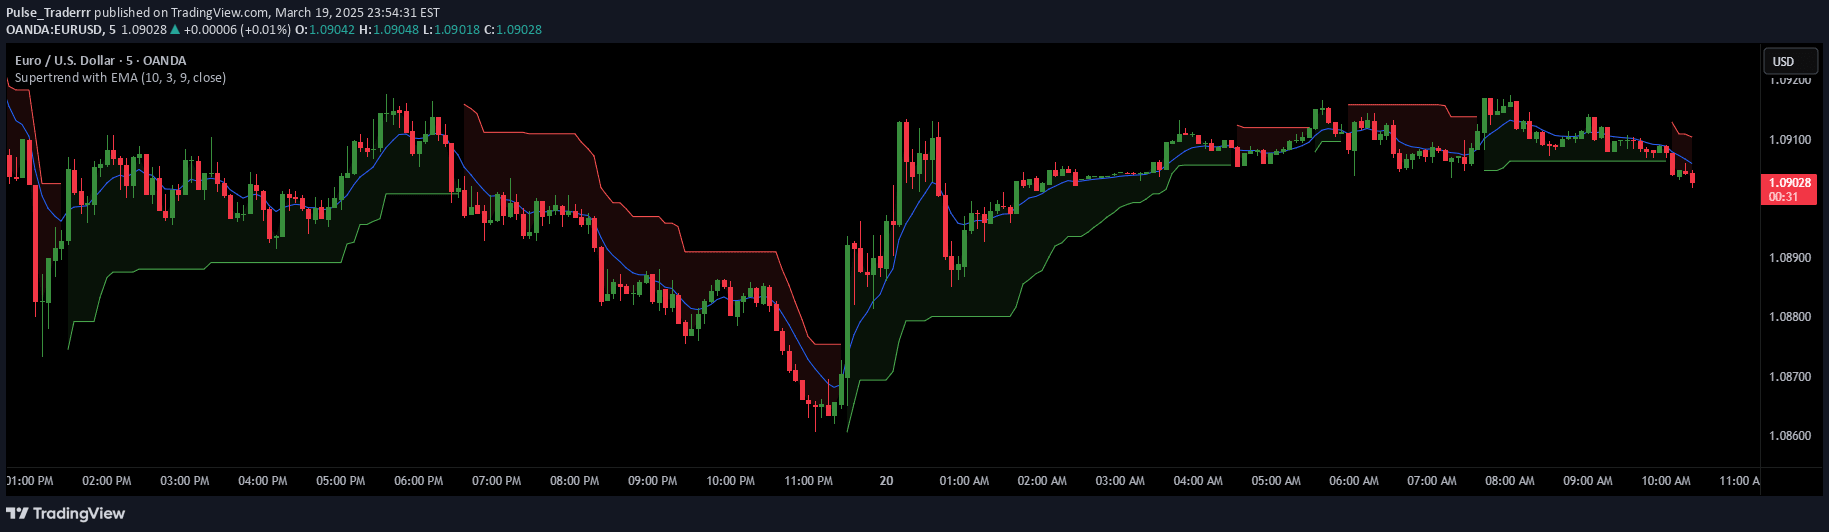
A dynamic trading indicator that combines trend-following with volatility-based target levels, using Average True Range to generate actionable trading signals and potential price movement insights.
Explore complementary indicator rolesHow it works
The Supertrend Targets indicator operates by utilizing the Average True Range (ATR) and a custom multiplier to determine market trend direction and potential price movements. It calculates dynamic support and resistance levels by analyzing price volatility and historical trend reversals.
The indicator generates multiple target lines representing potential gain and drawdown levels across different percentiles. By adjusting parameters like window length, scale, and custom levels, traders can fine-tune the indicator to match their specific trading strategy and market conditions.
Why it may be useful
The Supertrend Targets indicator provides traders with a comprehensive view of potential price movements by combining trend analysis and volatility metrics. It offers actionable insights through color-coded trend indicators and multiple target levels, helping traders make more informed decisions about entry and exit points.
By presenting a detailed summary table and visual plots, the indicator helps traders assess risk-reward ratios and understand potential market movements. Its flexibility in customization allows traders to adapt the tool to various market conditions and trading styles.
When to explore it
The Supertrend Targets indicator is most effective in markets with clear trend movements and moderate to high volatility. It works best when traders want to identify potential trend reversals and set dynamic target levels based on historical price performance.
Traders can utilize this indicator across different timeframes, from scalping to swing trading, making it versatile for various trading strategies. It is particularly useful when looking to establish precise entry and exit points with a data-driven approach to market analysis.
Keep exploring
What we’ve verified
Access, alerts and repainting behaviour have not been independently verified for this indicator. Check the creator’s current publication and settings.
General descriptions and classifications are recovered research. Verified details above identify the specific checks we have completed. Check the creator’s current publication for later changes.