
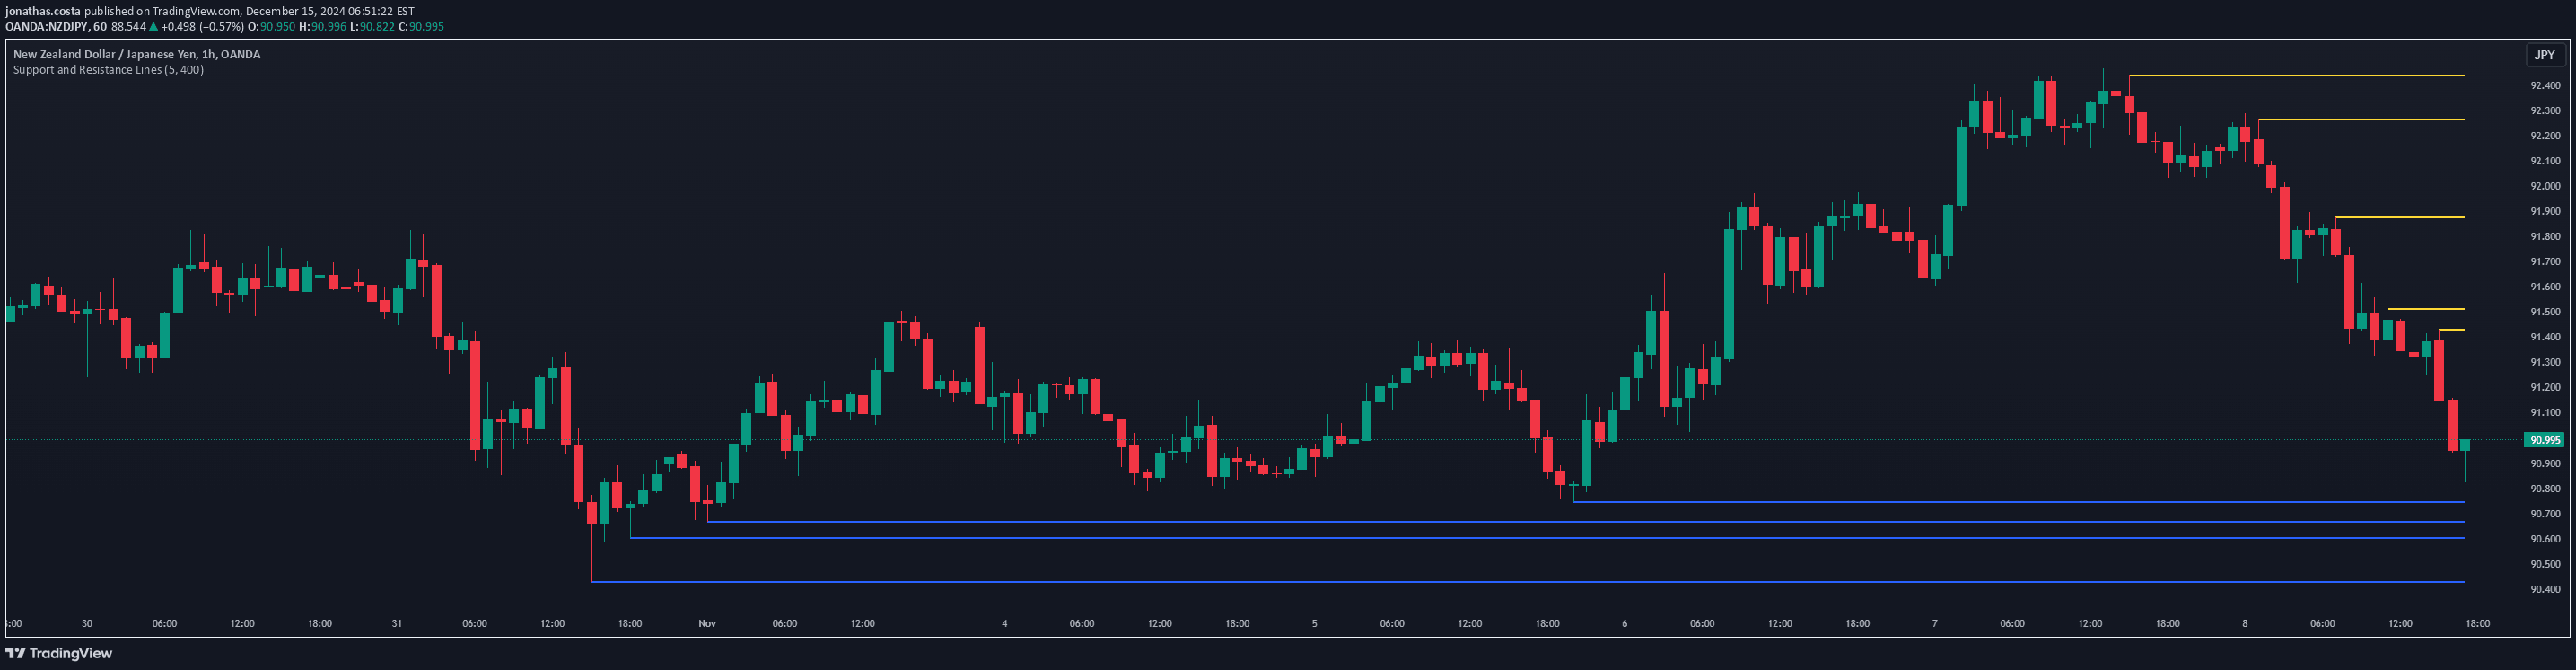
A trading signal that dynamically draws the last 5 support and resistance lines on the current chart timeframe with adjustable sensitivity.
Explore complementary indicator rolesHow it works
The signal identifies key support and resistance levels by analyzing recent price action and plotting the last 5 most significant horizontal lines. It operates by calculating potential turning points in price movement based on previous highs and lows using a sensitivity parameter that can be adjusted by modifying the 'diff' variable. The algorithm scans through recent price data to determine these critical levels, which represent potential areas where price might reverse or consolidate.
By dynamically generating these lines on the current timeframe, traders can quickly visualize potential entry, exit, and stop-loss points. The adjustable sensitivity allows traders to fine-tune the indicator to match the specific characteristics of different financial instruments and market conditions, making it a flexible tool for technical analysis.
Why it may be useful
Support and resistance lines are crucial for understanding market psychology and potential price reversal points. These lines represent areas where buying or selling pressure has historically been strong, providing traders with valuable insights into potential market movements and trader sentiment. By identifying these key levels, traders can make more informed decisions about market entry and exit points.
The dynamic nature of this signal ensures that traders are always working with the most recent and relevant price data. The ability to adjust sensitivity means traders can customize the indicator to suit different market conditions, trading styles, and individual risk tolerances, making it a versatile tool for technical analysis across various financial markets.
When to explore it
This signal is most effective in markets with clear trending or ranging behaviors where price tends to respect support and resistance levels. It works particularly well in liquid markets like forex, stocks, and cryptocurrency, where price movements are more predictable and technical levels have higher significance. Traders should use this signal when they want to identify potential entry and exit points based on recent market structure.
The indicator is especially useful during periods of market consolidation or when price is approaching known support or resistance zones. Traders should combine this signal with other technical and fundamental analysis tools to increase the probability of successful trades. It is most reliable when used in conjunction with trend confirmation indicators and proper risk management strategies.
Keep exploring
What we’ve verified
Access, alerts and repainting behaviour have not been independently verified for this indicator. Check the creator’s current publication and settings.
General descriptions and classifications are recovered research. Verified details above identify the specific checks we have completed. Check the creator’s current publication for later changes.





