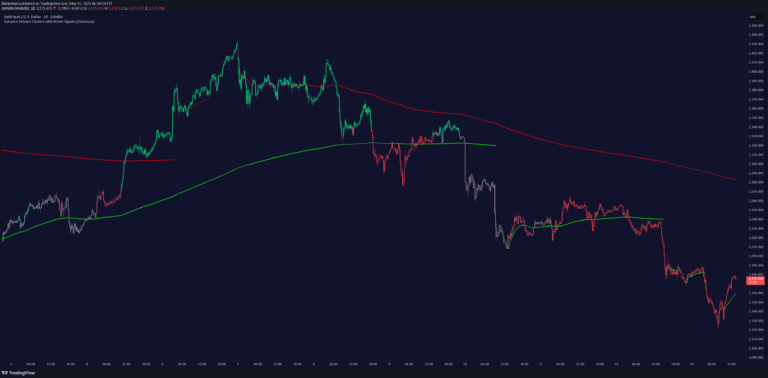
A TradingView indicator that identifies dynamic support and resistance levels using a 4-candle pattern and displays OHLC data across multiple timeframes.
Explore complementary indicator rolesHow it works
The indicator identifies support and resistance levels through a unique 4-candle pattern analysis. For support, it checks if the last three candles have lower lows and the current candle forms a higher low. Conversely, for resistance, it identifies when the last three candles have higher highs and the current candle creates a lower high.
Once these levels are detected, horizontal lines are drawn across the chart to mark the support and resistance zones. The indicator dynamically updates these lines, removing them when price breaks through the established levels, ensuring traders have real-time, adaptive market insights.
Why it may be useful
Support and resistance levels are crucial for understanding market psychology and potential price reversal points. By automatically identifying these dynamic levels, traders can make more informed decisions about entry, exit, and stop-loss strategies without manually drawing lines.
The additional OHLC data across different timeframes provides traders with a comprehensive view of market behavior, helping them contextualize short-term price movements within broader market trends and making complex market analysis more accessible.
When to explore it
This indicator is most effective in markets with clear trending or ranging characteristics where price tends to respect support and resistance levels. It works particularly well in liquid markets like forex, major stock indices, and cryptocurrency pairs where price movements are more predictable.
Traders should use this indicator in conjunction with other technical analysis tools to confirm signals and reduce false positives. It is especially useful during periods of consolidation or when seeking to identify potential breakout or breakdown points in market price action.
Keep exploring
What we’ve verified
Access, alerts and repainting behaviour have not been independently verified for this indicator. Check the creator’s current publication and settings.
General descriptions and classifications are recovered research. Verified details above identify the specific checks we have completed. Check the creator’s current publication for later changes.