
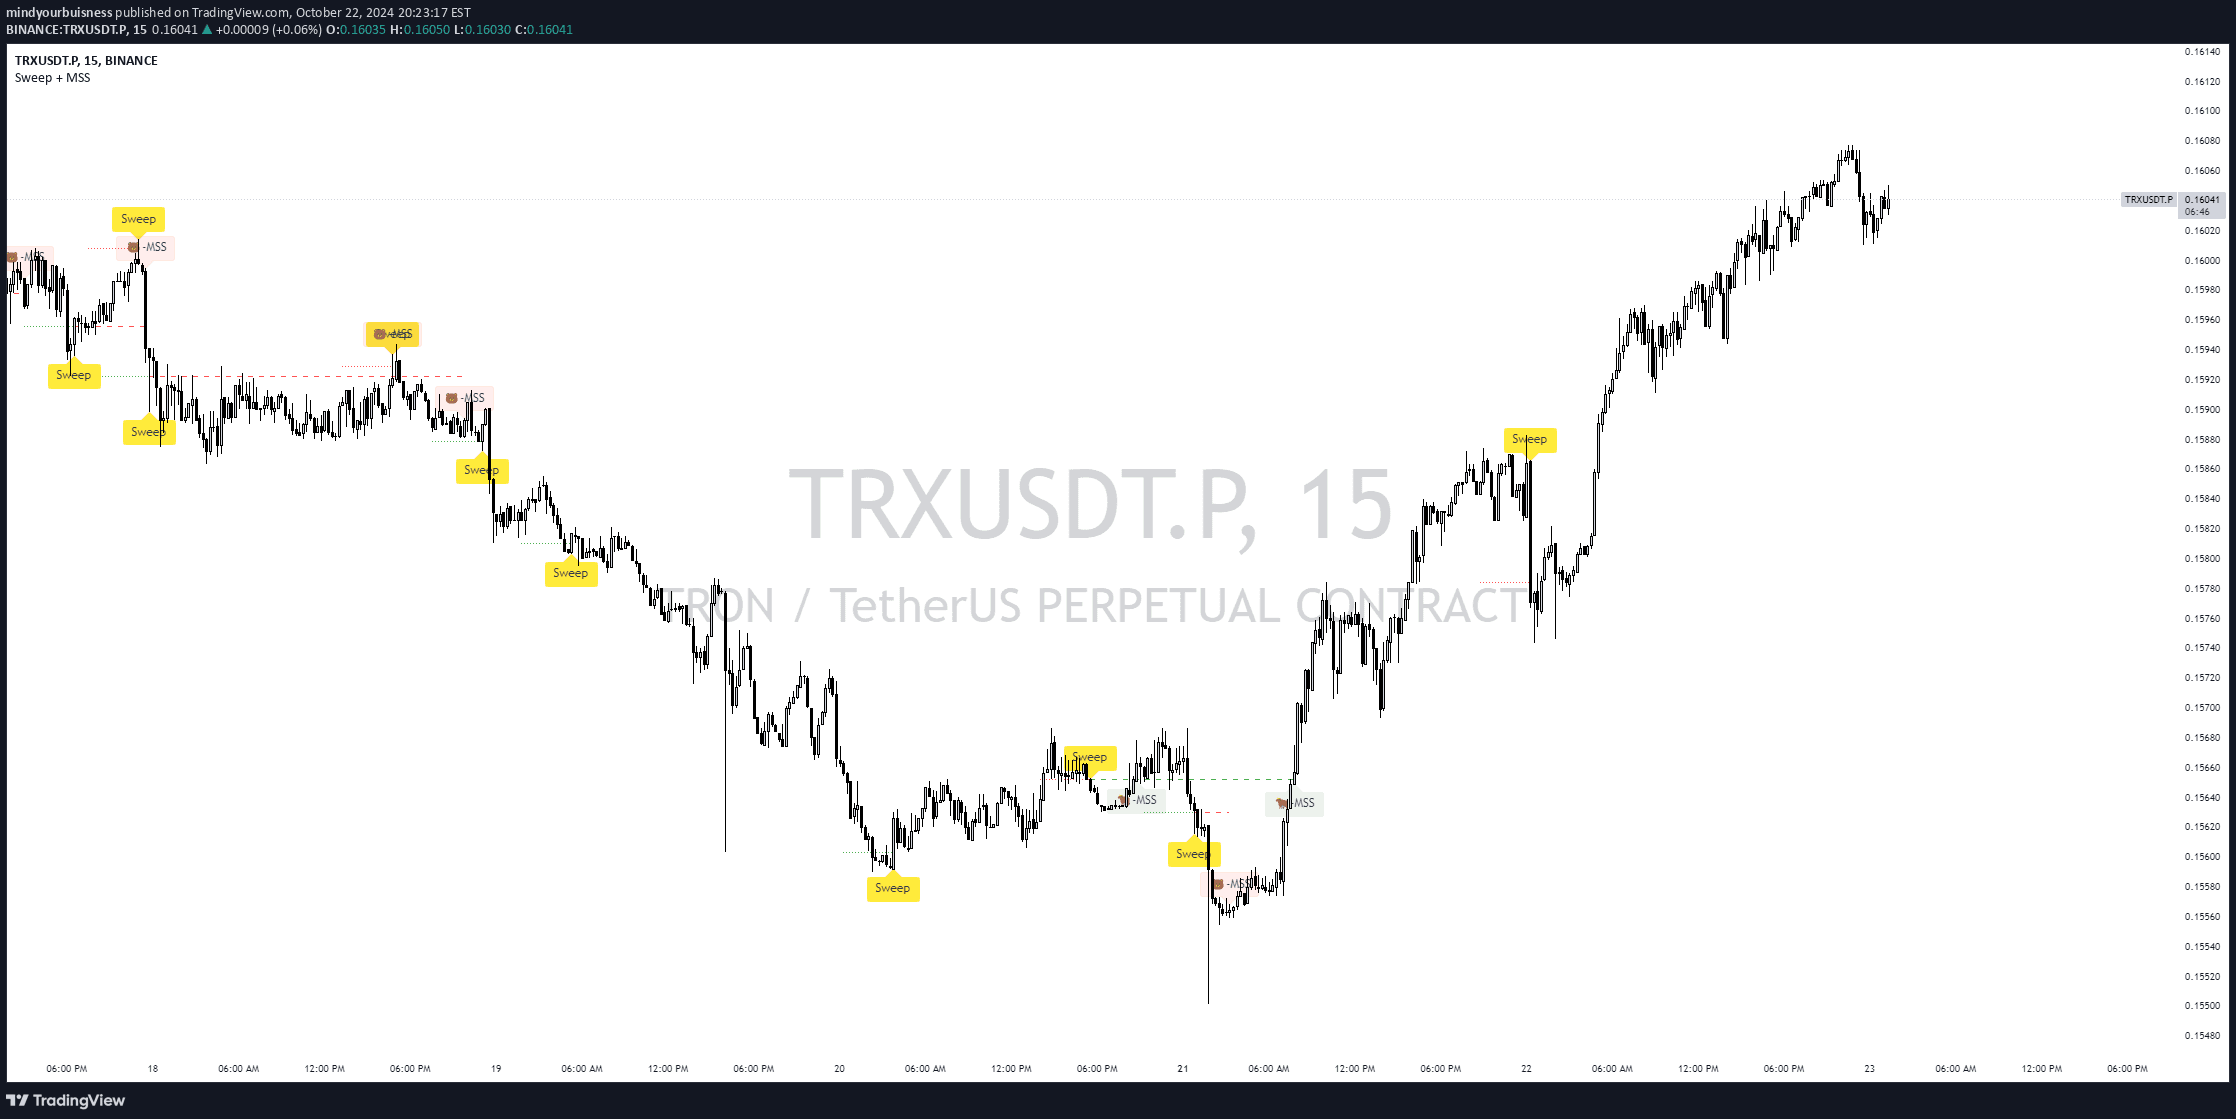
A market signal that identifies potential trend reversals by detecting sweep levels and market structure shifts, helping traders recognize critical price action changes.
Explore complementary indicator rolesHow it works
The Sweep + MSS Indicator operates by first detecting market sweeps, which occur when price briefly moves beyond a recent high or low pivot point before reversing. A bullish sweep happens when price drops below a recent low and then closes above it, while a bearish sweep occurs when price rises above a recent high and then closes below it.
Subsequently, the indicator identifies Market Structure Shifts (MSS) by tracking when price action invalidates a previous sweep level. A bullish MSS emerges when price closes above a bearish sweep level, and a bearish MSS develops when price closes below a bullish sweep level, potentially signaling significant trend changes.
Why it may be useful
This indicator provides traders with a sophisticated method to detect potential market sentiment shifts and trend reversals by analyzing price action dynamics. By identifying sweep levels and subsequent market structure changes, traders can gain insights into emerging momentum and potential trend direction.
The signal helps traders recognize critical moments when market psychology might be transforming, offering early warning signs of potential trend reversals. Its ability to filter out market noise and focus on significant structural changes makes it a valuable tool for understanding underlying market dynamics and making more informed trading decisions.
When to explore it
The Sweep + MSS Indicator is most effective in markets with clear trending behaviors and sufficient price volatility, such as forex, futures, and actively traded stocks. It works best when there are distinct price movements that create meaningful pivot points and potential sweep scenarios.
Traders should apply this indicator across multiple timeframes, from short-term scalping to longer-term swing trading, to validate potential entry and exit points. It is particularly useful during periods of market transition, when price action suggests potential trend reversals or significant momentum shifts.
Keep exploring
What we’ve verified
Access, alerts and repainting behaviour have not been independently verified for this indicator. Check the creator’s current publication and settings.
General descriptions and classifications are recovered research. Verified details above identify the specific checks we have completed. Check the creator’s current publication for later changes.


