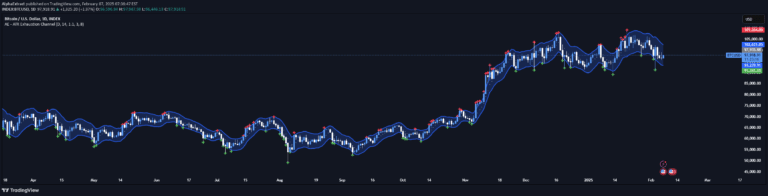
A trading script combining EMA crossovers and swing high/low detection to identify trend changes and potential reversal points for more comprehensive market analysis.
Explore complementary indicator rolesHow it works
The script utilizes two exponential moving averages (EMAs) with different periods to track trend dynamics. A fast EMA (50-period) and a slow EMA (200-period) are calculated using closing prices, creating crossover signals when they intersect.
Simultaneously, the script employs pivot point detection to identify significant swing high and low points in price action. It uses technical analysis functions to mark these points, categorizing them as higher highs, lower highs, higher lows, and lower lows to provide visual insights into potential trend reversals.
Why it may be useful
By combining EMA crossovers with swing point analysis, traders gain a more comprehensive view of market trends and potential reversal zones. The EMA crossovers help identify momentum shifts, while swing point detection provides critical insights into price structure and potential trend changes.
This multi-dimensional approach allows traders to validate trend directions, recognize emerging market dynamics, and make more informed trading decisions by considering both trend momentum and price action patterns.
When to explore it
This script is most effective in markets with clear trending characteristics, such as forex, stocks, and cryptocurrencies with moderate volatility. It performs best on daily and higher timeframes where trend signals are more reliable and less prone to noise.
Traders should use this script in conjunction with other technical and fundamental analysis tools to confirm signals and manage risk. It is particularly useful for identifying potential entry and exit points during established trends and detecting early signs of trend reversals.
Keep exploring
What we’ve verified
Access, alerts and repainting behaviour have not been independently verified for this indicator. Check the creator’s current publication and settings.
General descriptions and classifications are recovered research. Verified details above identify the specific checks we have completed. Check the creator’s current publication for later changes.