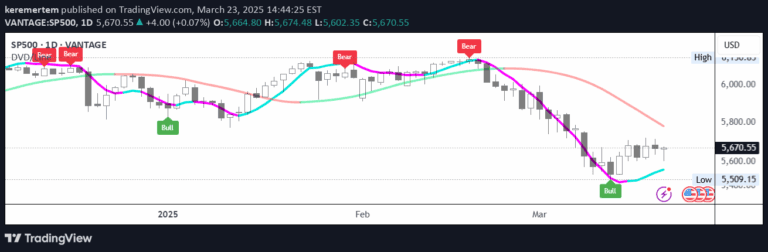
A pairs trading correlation indicator that measures the relationship between two assets using closing, open, high, and low prices to identify trading opportunities.
Explore complementary indicator rolesHow it works
The pairs trading correlation indicator calculates the statistical relationship between two assets by analyzing their price movements across different price points: closing, open, high, and low. It generates multiple correlation lines that help traders understand the strength and consistency of the relationship between two securities.
The indicator uses correlation coefficients ranging from -1 to 1, with values closer to 1 or -1 indicating stronger relationships. Green lines represent high correlation, while gray lines indicate weak or no significant correlation. Traders can visually assess the correlation by examining how closely these lines track each other over time.
Why it may be useful
Pairs trading correlation is crucial for identifying potentially profitable trading opportunities by discovering assets that move together or inversely. By understanding the relationship between two securities, traders can develop more sophisticated trading strategies that capitalize on statistical arbitrage and market inefficiencies.
The indicator provides a comprehensive view of asset relationships, allowing traders to make more informed decisions about potential pair trades. It helps reduce risk by highlighting assets with consistent, long-term correlations and avoiding pairs with sporadic or weak relationships.
When to explore it
This correlation indicator is most effective in neutral or range-bound markets where traditional trend-following strategies might underperform. It works best when analyzing assets within the same sector, industry, or with fundamentally similar characteristics that naturally create price dependencies.
Traders should use this indicator when seeking to develop robust pairs trading strategies, looking for sustained correlations over extended periods. It is particularly useful for investors interested in market-neutral approaches that can potentially generate returns regardless of overall market direction.
Keep exploring
What we’ve verified
Access, alerts and repainting behaviour have not been independently verified for this indicator. Check the creator’s current publication and settings.
General descriptions and classifications are recovered research. Verified details above identify the specific checks we have completed. Check the creator’s current publication for later changes.