Kalman Price Filter [BackQuant]
The Kalman Price Filter is an advanced algorithmic tool that smooths financial data, helping traders identify true market trends by filtering out noise and adaptively tracking price movements.
Explore 11,183 indicators. Filter beyond the obvious.
Discover the tools that fit the way you trade.
11,183 tools to explore
The Kalman Price Filter is an advanced algorithmic tool that smooths financial data, helping traders identify true market trends by filtering out noise and adaptively tracking price movements.
A machine learning tool that groups tickers with similar correlation coefficients to help traders analyze asset relationships and optimize trading strategies.
Historical Correlation tool calculates correlation coefficients between assets, revealing how different financial instruments move in relation to each other over time.
A comprehensive Currency Strength Indicator that uses True Strength Index to analyze relative currency strengths across multiple global currencies, providing traders with advanced market insights.
A comprehensive trading indicator that combines ADX, DI+, DI-, and Stochastic indicators to analyze trend strength and momentum for more informed trading decisions.
A Forex radar indicator that visualizes currency strength and weakness using a spider plot, offering traders insights into relative performance of different currencies.
A pair slope/hedge technique using linear regression to calculate the relationship between two assets, helping identify potential cointegration and trading opportunities.
A pairs trading correlation indicator that measures the relationship between two assets using closing, open, high, and low prices to identify trading opportunities.
An advanced trading tool that analyzes price divergences between two assets by creating a spread channel, helping traders identify potential arbitrage opportunities and market anomalies.
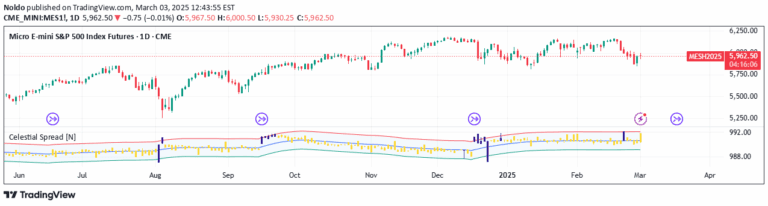
A pair trading strategy using CME futures contracts that creates a synthetic spread to analyze relative contract movements and potential trading opportunities across different contract months.
A multi-pair trading signal that identifies potential buy and sell opportunities by analyzing moving average crossovers on 15-minute and 1-hour charts across multiple currency pairs.
The Correlation Coefficient (CC) measures statistical relationship between two securities, revealing how they move relative to each other through a scale from -100 to +100.
Likes, views, and comments are historical TradingView snapshots. They describe attention, not trading performance.