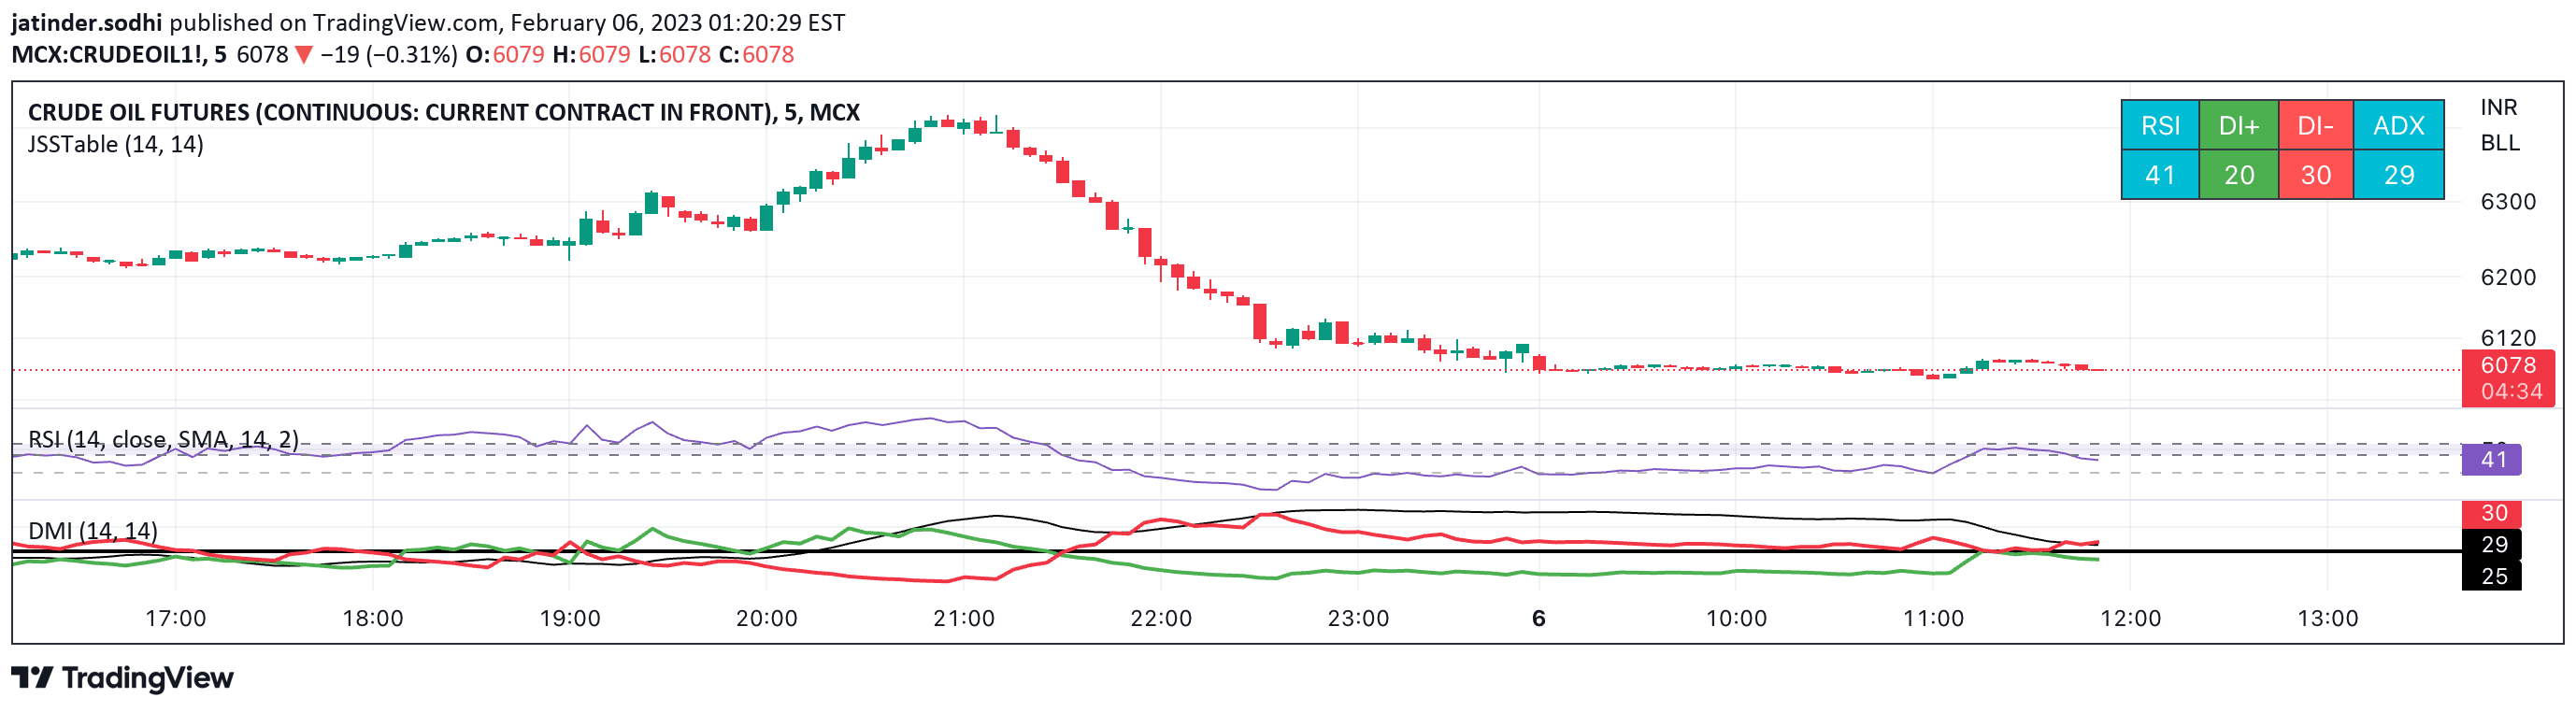
A comprehensive trading indicator combining RSI values across multiple timeframes and Ichimoku components to provide a detailed view of market momentum and trend strength.
Explore complementary indicator rolesHow it works
The RSI and Ichimoku Strength Table aggregates Relative Strength Index (RSI) values across different timeframes including 1-hour, 4-hour, 1-day, 3-day, and 1-week intervals. It simultaneously evaluates Ichimoku components such as the Conversion Line, Base Line, Cloud, and Lagging Span to provide a comprehensive market analysis.
The indicator uses color-coded displays to quickly communicate market conditions. RSI values are color-coded with red for over 70, green for under 30, and yellow for values between 30-70. Ichimoku components are color-coded green when above 50 and red when below 50, enabling traders to quickly assess market momentum and trend strength.
Why it may be useful
This indicator provides traders with a multi-dimensional view of market momentum, combining multiple timeframes and technical analysis components into a single, easy-to-read format. By integrating RSI and Ichimoku components, traders can gain deeper insights into market trends and potential price movements.
The color-coded visualization allows for rapid interpretation of market conditions, helping traders make quick and informed decisions. Its flexibility in layout and customization makes it adaptable to different trading styles and preferences, enhancing its utility across various market conditions and trading approaches.
When to explore it
The RSI and Ichimoku Strength Table is most effective during periods of market trend identification and momentum assessment. It works exceptionally well in markets showing clear directional movements, helping traders confirm trend strength and potential reversal points across multiple timeframes.
Traders should use this indicator when seeking a comprehensive view of market conditions, particularly during volatile market periods or when transitioning between different market states. Its multi-timeframe approach makes it valuable for scalpers, day traders, and swing traders looking to validate their trading strategies and potential entry or exit points.
Keep exploring
What we’ve verified
Access, alerts and repainting behaviour have not been independently verified for this indicator. Check the creator’s current publication and settings.
General descriptions and classifications are recovered research. Verified details above identify the specific checks we have completed. Check the creator’s current publication for later changes.