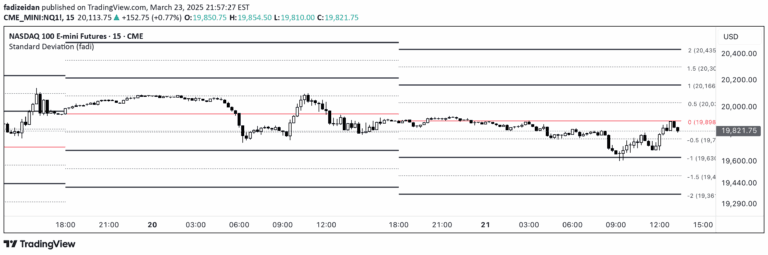
A trading signal analyzing stock price behaviors after significant price movements, helping traders understand potential patterns and expectations during volatile market conditions.
Explore complementary indicator rolesHow it works
The signal examines stock price movements by tracking opening gaps and extreme closes within predefined percentage ranges. It calculates the frequency of directional price movements and quantifies average pullbacks and closing behaviors. The analysis breaks down price changes into specific directional categories, measuring upward and downward price shifts.
Traders input parameters to customize the analysis for specific stock behaviors. The script generates a comprehensive table showing historical price movement patterns. It provides statistical insights into how prices typically react after significant market events
Why it may be useful
Understanding price movement patterns can help traders make more informed decisions during volatile market conditions. The signal provides scientific insights into stock price behaviors after substantial price changes. By quantifying historical trends, traders can develop more strategic entry and exit points.
The analysis helps reduce uncertainty by revealing typical market reactions to extreme price movements. Traders can better anticipate potential pullbacks and closing patterns. The method offers a data-driven approach to understanding market dynamics. It transforms subjective market observations into measurable, actionable insights
When to explore it
This signal is most effective during periods of high market volatility, such as earnings seasons or significant economic events. It works best for stocks experiencing substantial price gaps or extreme closes. Traders can utilize the signal when seeking to understand potential price reversal points.
It is particularly useful for swing traders and day traders looking to analyze short-term price movements. The signal provides valuable insights during market transitions or when stocks show unusual price behaviors. It can help traders prepare for potential pullbacks or continuations after significant price shifts. The analysis is most beneficial when applied to liquid, actively traded stocks
Keep exploring
What we’ve verified
Access, alerts and repainting behaviour have not been independently verified for this indicator. Check the creator’s current publication and settings.
General descriptions and classifications are recovered research. Verified details above identify the specific checks we have completed. Check the creator’s current publication for later changes.