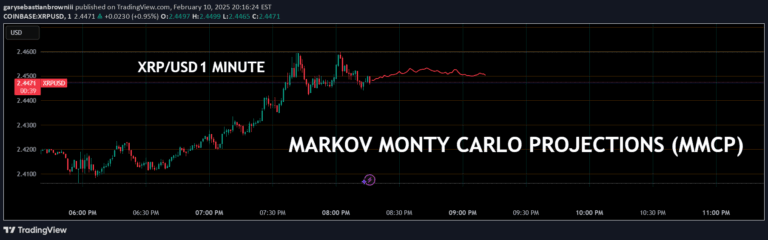
A Monte Carlo simulation trading visualization tool that generates multiple price path simulations resembling a dragon's fire, offering an artistic interpretation of potential market movements.
Explore complementary indicator rolesHow it works
The Dragon's Maw indicator uses historical price data to calculate returns and generate multiple potential price paths through Monte Carlo simulation. It employs either normal distribution or bootstrap sampling techniques to create simulated trajectories, rendering them with high transparency to produce a fire/smoke visual effect.
By plotting these simulated paths, the indicator creates a dense, dragon-like visualization where higher probability regions appear more concentrated. The simulation's direction is influenced by recent price movements, with the indicator's 'eye' representing the historical data limit used for generating potential future price scenarios.
Why it may be useful
The Dragon's Maw provides traders with a unique, visually engaging method to understand potential price movement probabilities and market uncertainty. By generating multiple potential price paths, it helps traders recognize the inherent unpredictability of financial markets and the limitations of statistical projections.
This visualization tool serves an educational purpose, demonstrating how statistical models can suggest trend continuations but cannot accurately predict sudden market shifts. It encourages traders to approach predictive tools with skepticism and understand that past performance does not guarantee future results.
When to explore it
The Dragon's Maw is most effective when traders want to explore potential market scenarios and understand the range of probable price movements without relying on the visualization as a strict predictive tool. It works best in markets with relatively stable recent trends, where the simulation can provide insights into potential continuation patterns.
Traders can use this indicator to experiment with different historical data points by adjusting the 'Move to the Left' parameter, which allows positioning the dragon's head at various points in historical data. This feature helps illustrate how simulated paths diverge from actual price movements, reinforcing the importance of comprehensive market analysis.
Keep exploring
What we’ve verified
Access, alerts and repainting behaviour have not been independently verified for this indicator. Check the creator’s current publication and settings.
General descriptions and classifications are recovered research. Verified details above identify the specific checks we have completed. Check the creator’s current publication for later changes.