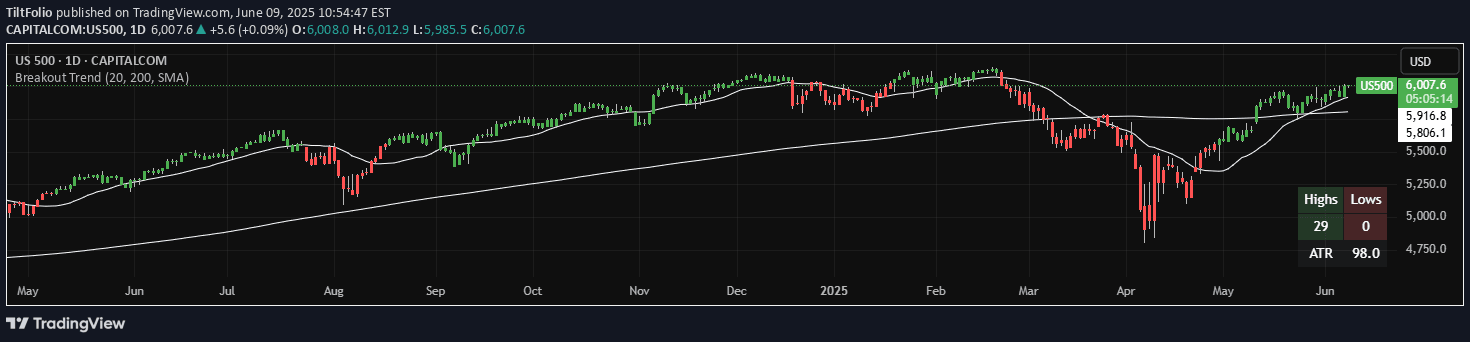
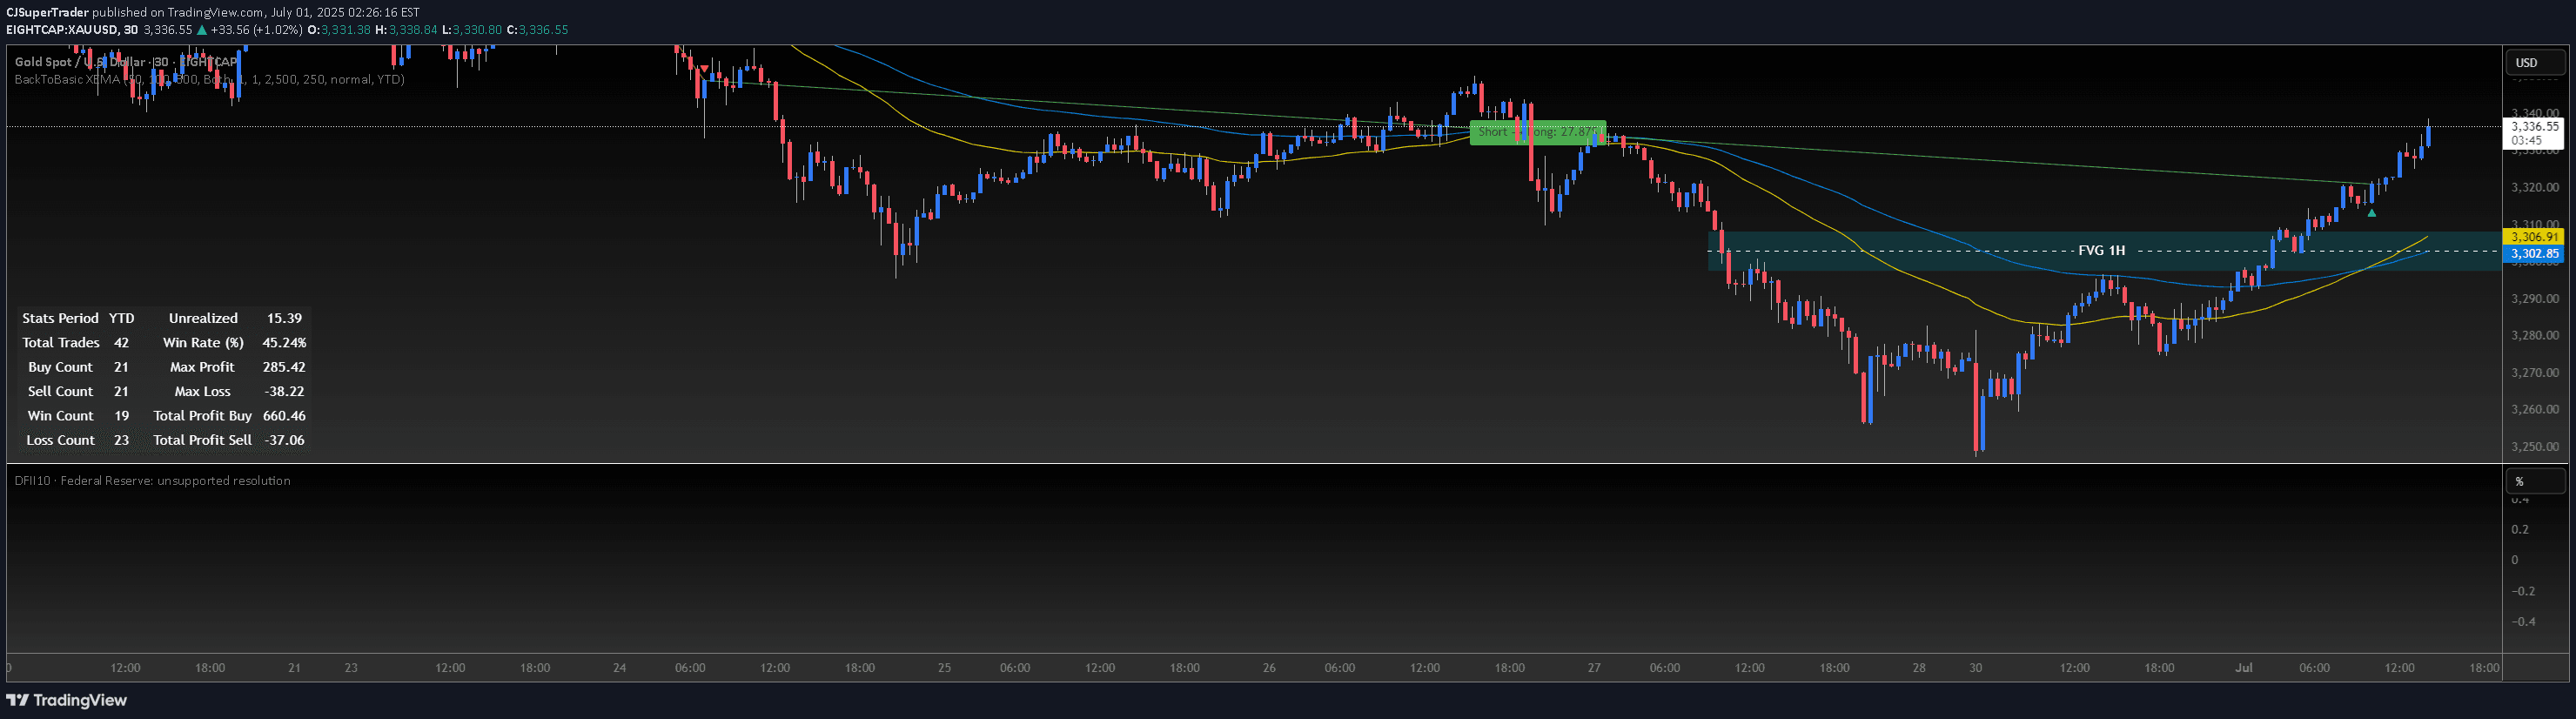
A technical analysis tool for Forex traders using dynamic EMA channels and engulfing candle patterns to identify high-probability trading opportunities across multiple timeframes.
Explore complementary indicator rolesHow it works
The GOD's EYE V1 operates by creating a dynamic EMA-based channel with upper and lower bands around the central moving average. It monitors price action to detect specific engulfing candle patterns that signal potential trend reversals or continuations. When a candle pattern emerges, the indicator evaluates its position relative to the EMA channel to confirm trading signals.
The script calculates these dynamic levels by adjusting the central EMA line with a configurable pip distance, creating visual reference points for support and resistance. Traders can customize the EMA length and band distances to suit their specific trading strategy, allowing for personalized interpretation of market conditions.
Why it may be useful
This indicator provides traders with a systematic approach to identifying potential trading opportunities by combining trend analysis with price action signals. By integrating EMA channels and engulfing patterns, it offers a comprehensive view of market dynamics that can help traders make more informed decisions. The visual signals and real-time alerts reduce the cognitive load of constant chart monitoring.
The GOD's EYE V1 is particularly valuable because it synthesizes multiple technical analysis techniques into a single, easy-to-interpret tool. Its ability to dynamically adjust to market conditions and provide clear entry and exit signals makes it a powerful resource for traders seeking a structured and methodical trading approach.
When to explore it
The GOD's EYE V1 is most effective when used on higher timeframes such as 4-hour and daily charts, where trend signals are more reliable and less prone to noise. It works best in trending markets where clear directional movements provide more predictable trading opportunities. Traders should look for confluence between the EMA channel signals and other technical or fundamental analysis.
This indicator is particularly suited for markets with moderate volatility, where price action patterns can be more clearly defined. Forex pairs and liquid stock indices are ideal candidates for this strategy. Traders should combine the signals with proper risk management techniques, using stop-loss and take-profit levels to maximize potential gains while minimizing potential losses.
Keep exploring
What we’ve verified
Access, alerts and repainting behaviour have not been independently verified for this indicator. Check the creator’s current publication and settings.
General descriptions and classifications are recovered research. Verified details above identify the specific checks we have completed. Check the creator’s current publication for later changes.