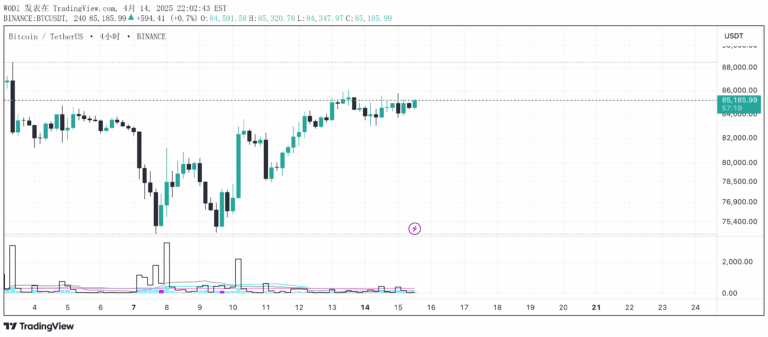
A trading signal that calculates theoretical price range by analyzing price changes and volume, helping traders understand potential price movement boundaries and volatility.
Explore complementary indicator rolesHow it works
The signal calculates price volatility by dividing price change by volume, treating volume as a change unit. It derives a theoretical variance difference relative to the current price, which allows for computing potential upper and lower price limits.
By analyzing the relationship between price movement and trading volume, the indicator creates theoretical high and low price boundaries. These boundaries are visualized on the chart with color-coded ranges, providing traders with a dynamic representation of potential price movement zones based on recent market activity.
Why it may be useful
This signal provides traders with a sophisticated method of understanding market dynamics by integrating both price and volume data into a predictive framework. It offers insights into potential price movements that go beyond traditional technical analysis by considering the interaction between price changes and trading volume.
The indicator helps traders identify potential market anomalies and unusual price movements by establishing theoretical price ranges. By visualizing these ranges and their statistical properties, traders can make more informed decisions about market entry, exit, and risk management strategies.
When to explore it
The signal is most effective in markets with significant price volatility and substantial trading volume, such as during major economic announcements or earnings reports. It works best when there are clear trends or significant price movements that can be analyzed through volume-based calculations.
Traders should utilize this signal when seeking to understand potential price boundaries and assess market momentum. It is particularly useful for short-term trading strategies that require quick, data-driven decision-making and a nuanced understanding of market behavior.
Keep exploring
What we’ve verified
Access, alerts and repainting behaviour have not been independently verified for this indicator. Check the creator’s current publication and settings.
General descriptions and classifications are recovered research. Verified details above identify the specific checks we have completed. Check the creator’s current publication for later changes.