
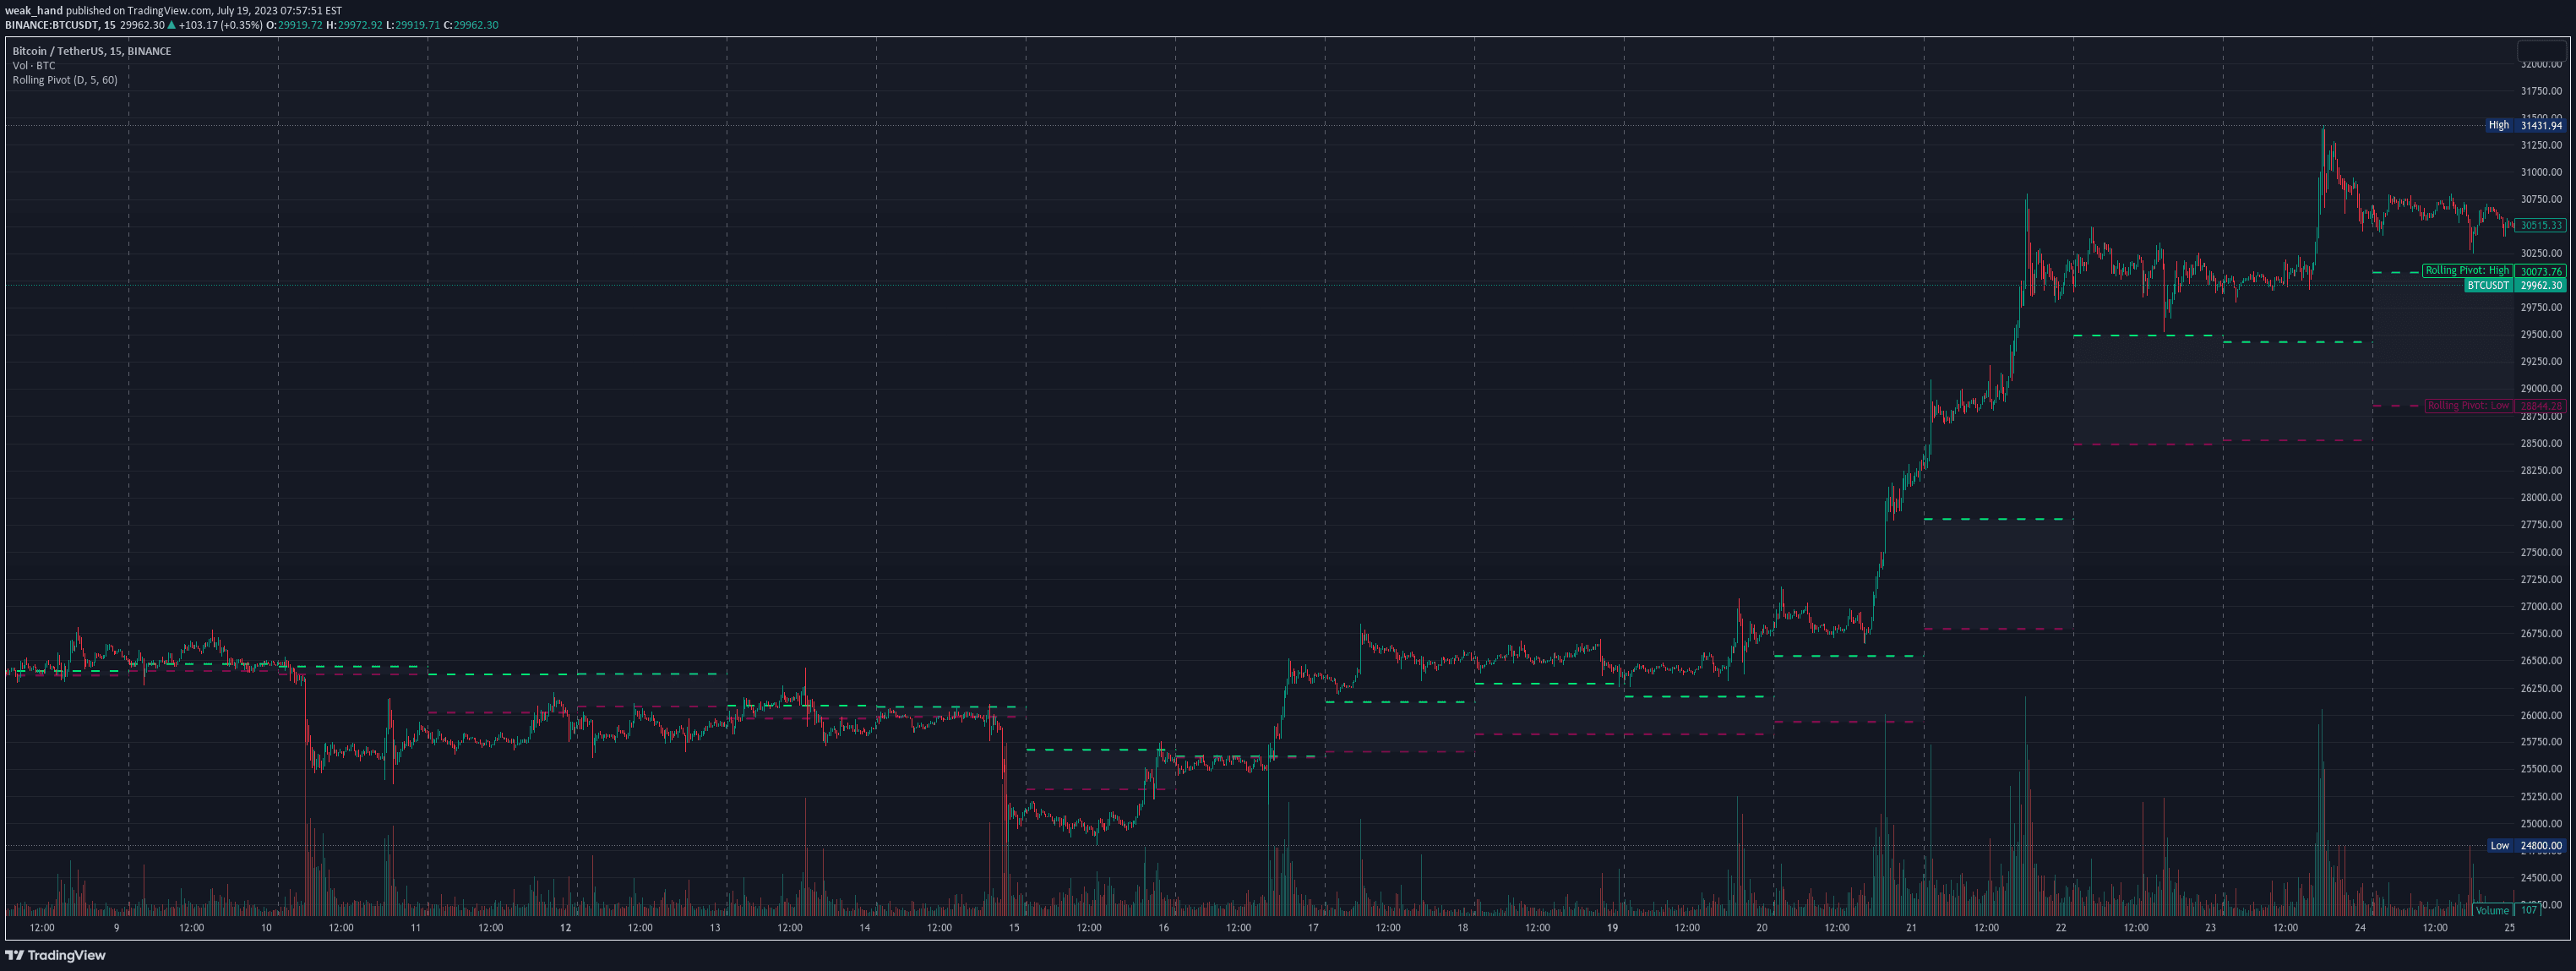
A three-day rolling pivot indicator that calculates a dynamic price level using the highest high, lowest low, and closing prices from the past three trading days.
Explore complementary indicator rolesHow it works
The three-day rolling pivot calculates a dynamic price level by first identifying the highest high and lowest low across the past three trading days. It then determines a pivot point by averaging the highest high, lowest low, and the closing price from the last day.
The script rounds the calculations to the nearest minimum tick of the security. It creates upper and lower lines based on the pivot calculations, which can serve as potential entry and exit points for traders seeking to identify short-term market movements.
Why it may be useful
This pivot indicator provides traders with a flexible, dynamic method of identifying potential market entry and exit points based on recent price action. By incorporating the highest high, lowest low, and closing price from the past three days, it offers a more nuanced approach to determining support and resistance levels.
The indicator helps traders make more informed decisions by providing a customizable tool that adapts to recent market conditions. It can be particularly useful for traders looking to capture short-term price movements and manage risk through strategic positioning.
When to explore it
The three-day rolling pivot works best in markets with moderate volatility and clear short-term trends. It is particularly effective for traders seeking to identify potential entry and exit points within a three-day trading window. The indicator can be especially useful in day trading and scalping scenarios.
Traders should use this pivot in conjunction with other technical analysis tools to confirm signals and validate potential trade opportunities. It is most effective when applied to liquid markets with consistent price movements and when combined with additional technical and fundamental analysis.
Keep exploring
What we’ve verified
Access, alerts and repainting behaviour have not been independently verified for this indicator. Check the creator’s current publication and settings.
General descriptions and classifications are recovered research. Verified details above identify the specific checks we have completed. Check the creator’s current publication for later changes.


