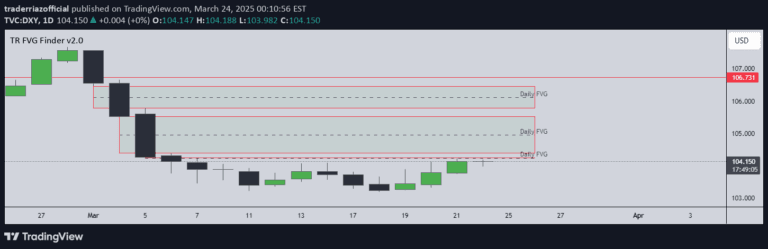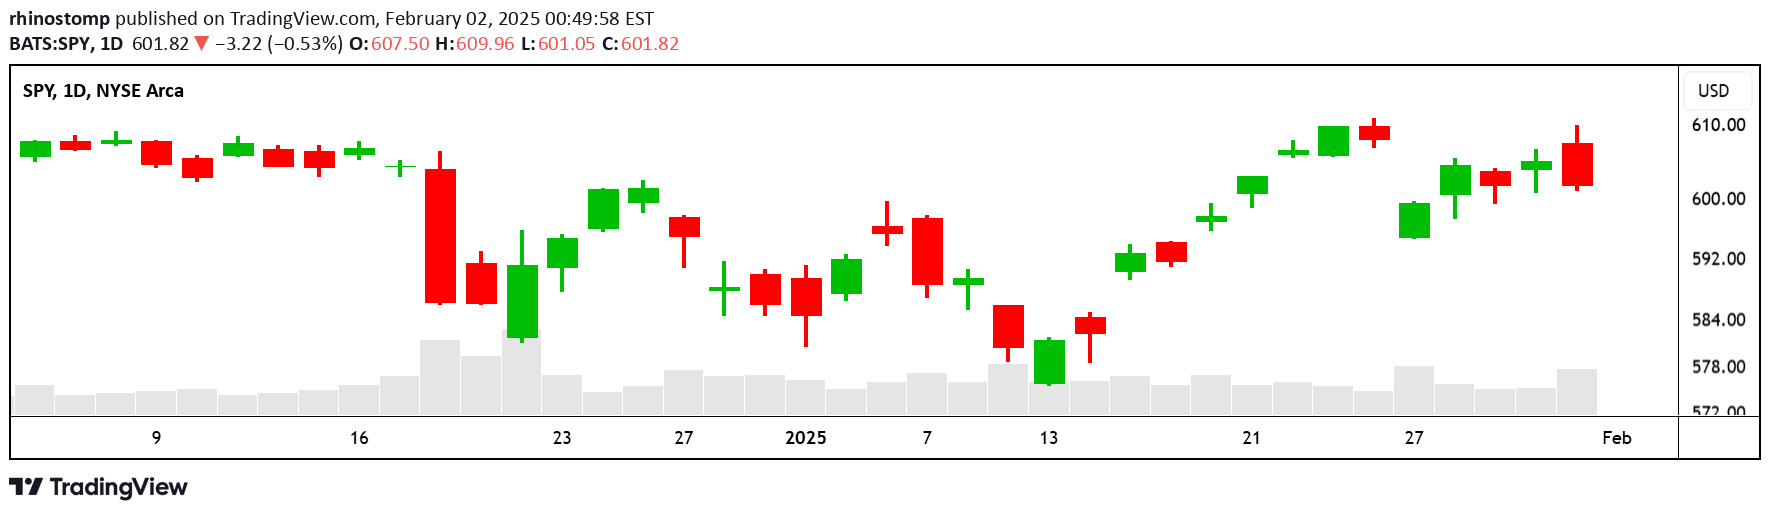
A visual enhancement technique that thickens vertical candle lines to improve chart readability and emphasize price movement direction through adjustable colors and line thickness.
Explore complementary indicator rolesHow it works
This technique modifies the visual representation of price bars by drawing thick vertical lines behind candles, effectively emphasizing the price movement's direction and magnitude. The thicker lines are designed to highlight the price bar's characteristics, making it easier for traders to quickly interpret market dynamics and price action at a glance.
By allowing adjustable thickness and color differentiation between up and down bars, traders can customize the visual display to suit their preferences and improve chart readability. The method essentially transforms standard price bars into more visually distinctive and informative graphical elements that provide immediate visual cues about market sentiment and price movement.
Why it may be useful
Enhanced bar visualization helps traders quickly identify price movement trends and market sentiment by making chart patterns more immediately comprehensible. The visual emphasis on price bars allows for faster pattern recognition and reduces the cognitive load required to interpret market movements.
By providing customizable color and thickness options, this technique allows traders to personalize their chart appearance to match their trading style and visual preferences. The improved visual clarity can lead to faster decision-making and potentially more accurate interpretation of market dynamics, which is crucial in fast-moving trading environments.
When to explore it
This visualization technique is most effective during volatile market conditions where price movements are rapid and complex. Traders can benefit from using this method across various financial instruments and timeframes, from short-term scalping to longer-term swing trading scenarios.
The technique is particularly useful for traders who rely heavily on visual pattern recognition and want to quickly distinguish between bullish and bearish price movements. It works well in markets with clear directional trends and can help traders maintain focus during intense trading sessions by providing clear, immediate visual feedback about price action.
Keep exploring
What we’ve verified
Access, alerts and repainting behaviour have not been independently verified for this indicator. Check the creator’s current publication and settings.
General descriptions and classifications are recovered research. Verified details above identify the specific checks we have completed. Check the creator’s current publication for later changes.