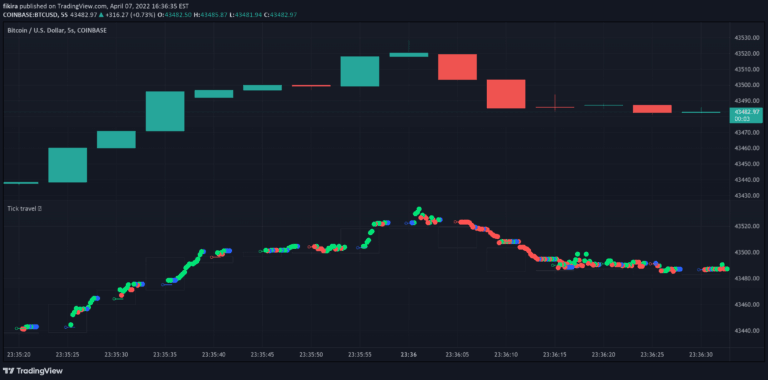
A tick data analysis indicator that captures real-time price and volume movements, providing detailed statistics on market tick behavior, price changes, and volume dynamics.
Explore complementary indicator rolesHow it works
The indicator captures tick-by-tick data during real-time candles, tracking individual price and volume movements. It records each tick's type (up, down, or no change), price, and volume.
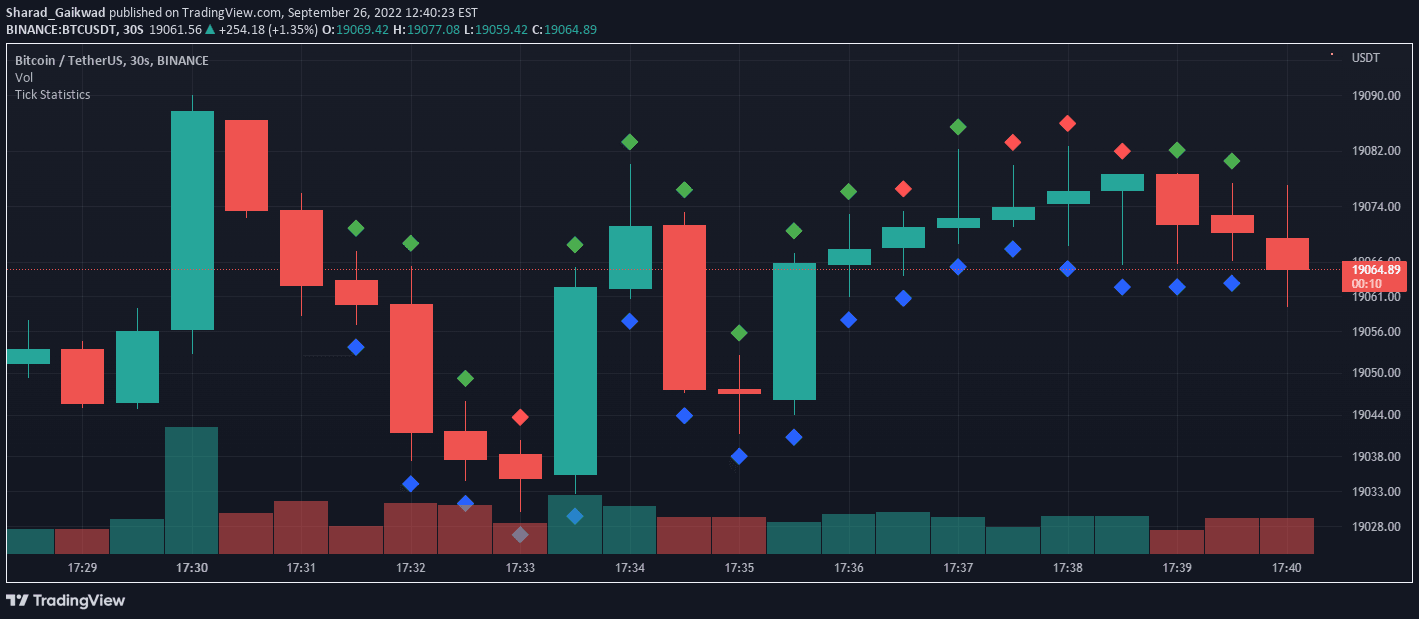
The system generates comprehensive statistics including total ticks, tick types, volume distribution, and extreme price-volume points. Two diamond-shaped markers are placed on the chart, one below displaying detailed tick data and another above showing aggregated statistics
Why it may be useful
Understanding tick-level market dynamics provides traders with granular insights into price and volume interactions. This detailed analysis helps identify subtle market movements and sentiment shifts that might not be apparent on standard price charts.
By breaking down each tick's characteristics, traders can gain a deeper understanding of market microstructure, potential trend reversals, and volume-driven price changes
When to explore it
This indicator is most effective during active trading sessions with high market liquidity and frequent price movements. It's particularly useful for traders focusing on short-term strategies like scalping and day trading. Traders can leverage these insights to understand market psychology, confirm trend strength, and make more informed entry and exit decisions based on microscopic price and volume behaviors
Keep exploring
What we’ve verified
Access, alerts and repainting behaviour have not been independently verified for this indicator. Check the creator’s current publication and settings.
General descriptions and classifications are recovered research. Verified details above identify the specific checks we have completed. Check the creator’s current publication for later changes.