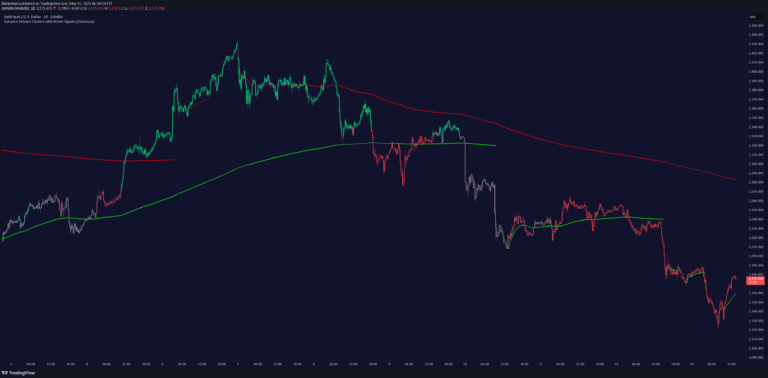
A dynamic indicator measuring percentage price changes across specified timeframes, visualizing market movements through color-coded histograms for intuitive financial analysis.
Explore complementary indicator rolesHow it works
The time change indicator calculates price variations by retrieving current and previous closing prices within a user-defined timeframe. It computes both absolute and percentage price changes, using dynamic data processing to track market movements.
The script employs request.security to fetch closing price data, ensuring consistent results across different chart timeframes. By normalizing price changes, the indicator transforms raw price data into a percentage-based visualization that adapts to various market conditions.
Why it may be useful
This indicator provides traders with a normalized view of price movements, enabling quick assessment of market momentum and directional trends. By converting price changes to percentages, it allows for more meaningful comparisons across different assets and timeframes.
The color-coded histogram and dynamic labeling make complex financial data instantly comprehensible, helping traders rapidly identify market sentiment and potential trading opportunities. Its flexibility in timeframe selection and visual representation enhances strategic decision-making.
When to explore it
The time change indicator is most effective during periods of market volatility, where quick identification of price movements becomes crucial for trading decisions. It works well across multiple asset classes, from stocks and forex to cryptocurrencies, providing consistent analytical insights.
Traders can leverage this tool during trending markets, breakout scenarios, and when comparing performance across different financial instruments. Its adaptability makes it particularly useful for short-term trading strategies that require rapid assessment of price dynamics.
Keep exploring
What we’ve verified
Access, alerts and repainting behaviour have not been independently verified for this indicator. Check the creator’s current publication and settings.
General descriptions and classifications are recovered research. Verified details above identify the specific checks we have completed. Check the creator’s current publication for later changes.