A time-based trading indicator that plots vertical markers at specific intraday times, helping traders identify potential market behavior patterns and key trading moments.
Explore complementary indicator rolesHow it works
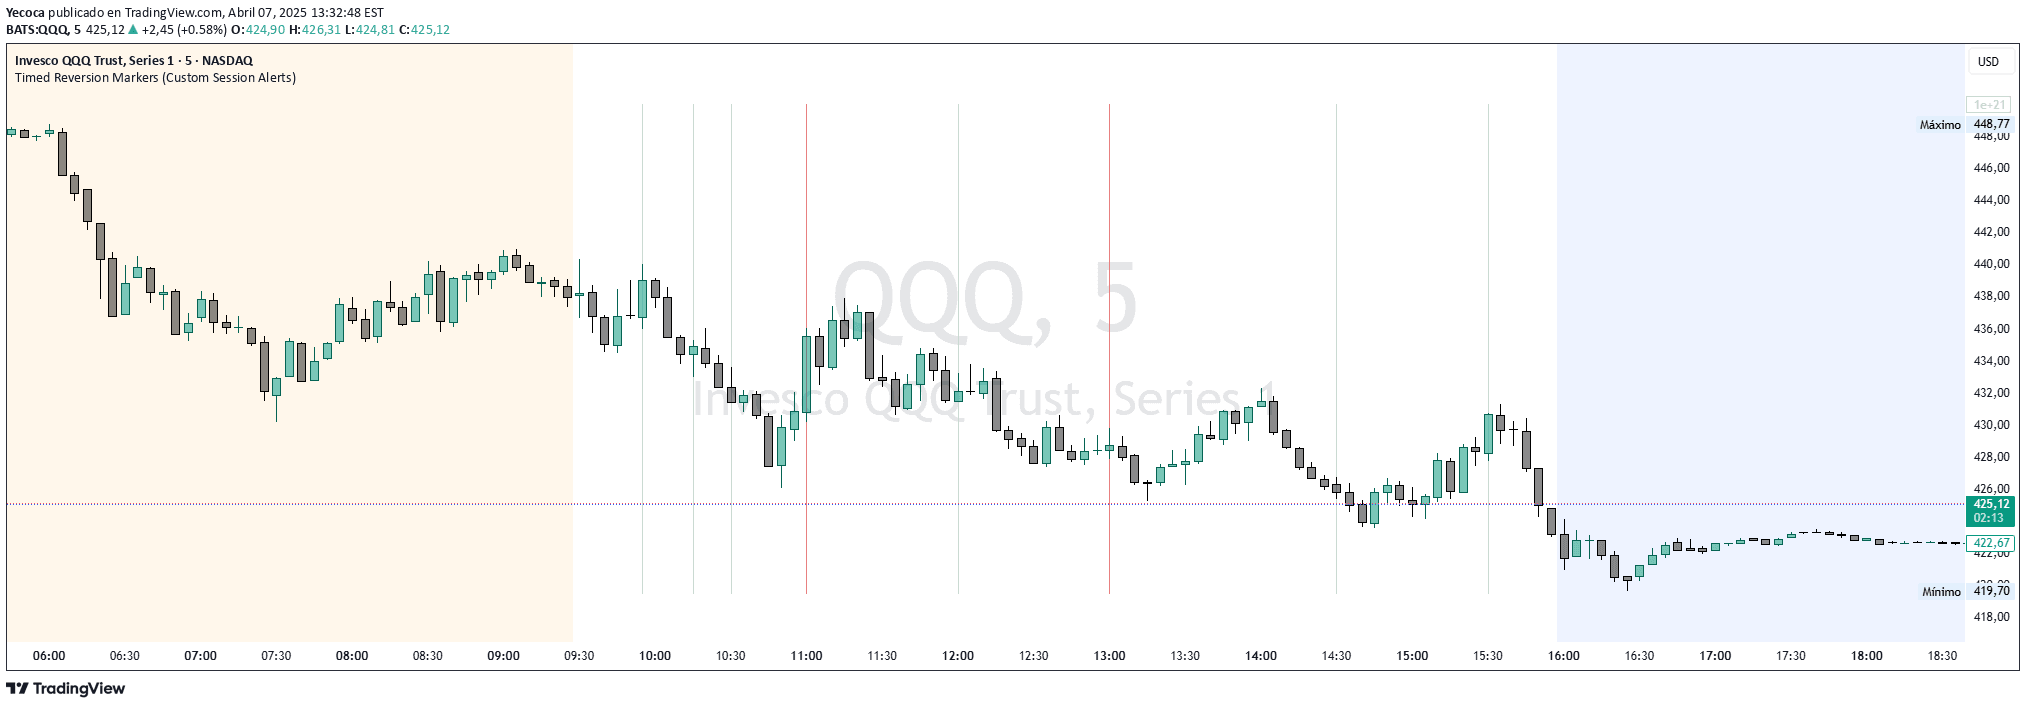
The indicator allows traders to input eight precise time points using decimal hour format. Each input is converted to hour and minute format and plots a vertical histogram marker once per day at the exact specified time. These markers appear at the top of the chart without interfering with price candles.
The tool converts user-defined times into precise plotting coordinates, enabling traders to mark specific moments of potential market interest. The markers serve as visual checkpoints for traders monitoring time-based market behaviors
Why it may be useful
This indicator provides traders with a unique way to visualize time-based market patterns that might otherwise go unnoticed. It helps identify potential institutional trading times, market reversals, and volatility windows.
By marking specific time points, traders can develop more structured trading strategies based on recurring market behaviors. The non-intrusive markers allow for easy visualization without cluttering the chart. It supports systematic analysis of time-cycle trading approaches and helps traders recognize potential entry or exit points
When to explore it
The indicator works best during active trading sessions with consistent volume and liquidity. It is particularly useful for day traders tracking institutional trading hours, midday market movements, and end-of-day volatility. Traders can leverage this tool in markets with predictable time-based behaviors, such as stock indices, forex, and futures.
It is most effective when combined with other technical analysis tools and when traders have identified recurring patterns at specific times. The indicator can help validate time-based trading hypotheses and support algorithmic trading strategies
Keep exploring
What we’ve verified
Access, alerts and repainting behaviour have not been independently verified for this indicator. Check the creator’s current publication and settings.
General descriptions and classifications are recovered research. Verified details above identify the specific checks we have completed. Check the creator’s current publication for later changes.