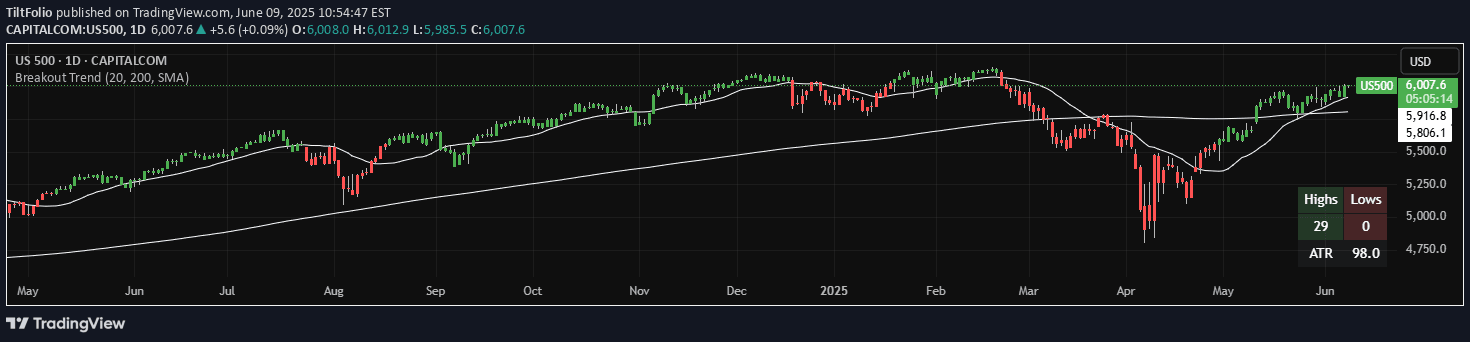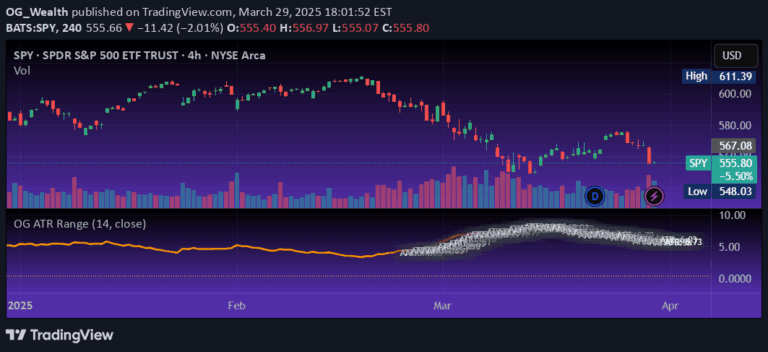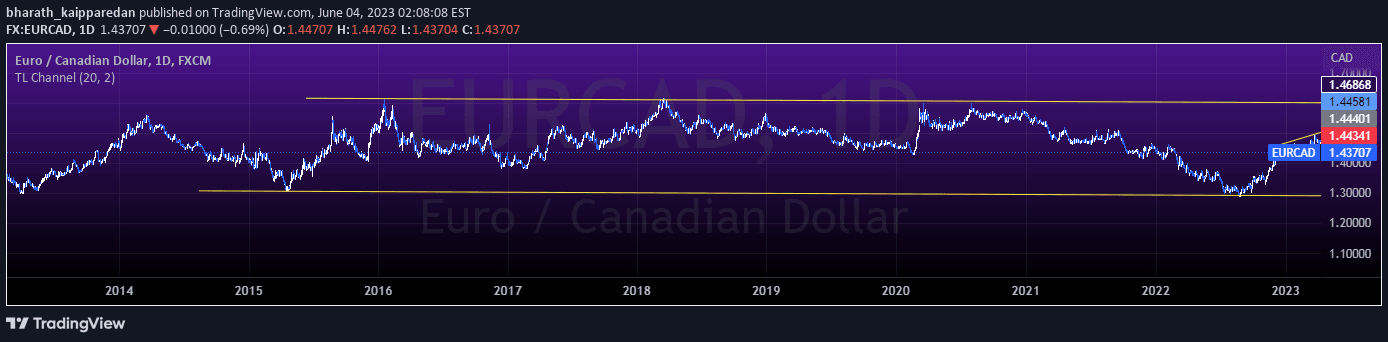
A trading strategy that identifies trend line channels and detects potential false breakouts by tracking price movements across multiple taps on upper and lower trend lines.
Explore complementary indicator rolesHow it works
The strategy begins by defining input parameters like lookback period and threshold for trend line detection. It systematically analyzes price action to identify upper and lower trend lines by comparing current high and low prices with adjacent bars.
As the analysis progresses, the script tracks the number of taps on these trend lines, waiting until the fourth tap to assess potential false breakout conditions. When the price breaks above the upper trend line or below the lower trend line on the fifth tap, the strategy generates a false breakout signal.
Why it may be useful
This signal provides traders with a sophisticated method to recognize potential trend reversals and market deception. By identifying false breakouts, traders can avoid being trapped in misleading price movements and make more informed trading decisions.
The strategy offers a visual representation of trend line channels, helping traders understand market dynamics and potential trend continuation or reversal points. It enhances traders' ability to detect subtle market movements and anticipate potential price action before significant shifts occur.
When to explore it
The strategy works best in markets with clear trending characteristics and well-defined price channels. It is particularly effective in volatile markets where false breakouts are common and can provide valuable trading opportunities.
Traders should apply this signal in timeframes that allow sufficient price action for trend line development, such as intraday and short-term trading scenarios. It is most reliable when combined with additional confirmation indicators and used alongside comprehensive risk management strategies.
Keep exploring
What we’ve verified
Access, alerts and repainting behaviour have not been independently verified for this indicator. Check the creator’s current publication and settings.
General descriptions and classifications are recovered research. Verified details above identify the specific checks we have completed. Check the creator’s current publication for later changes.