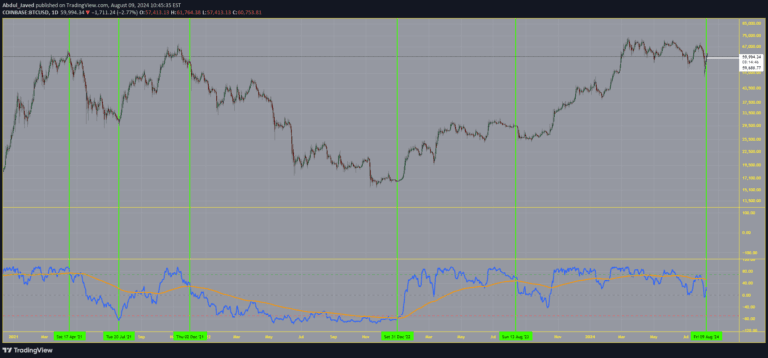
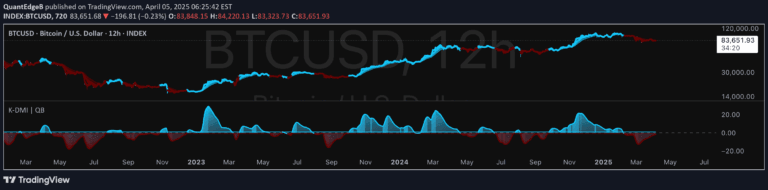
A combined trading indicator that calculates total momentum using RSI and TSI oscillators, providing insights into potential price movements through a comprehensive oscillator analysis.
Explore complementary indicator rolesHow it works
The TOTAL:(RSI+TSI) indicator combines two momentum oscillators to create a comprehensive momentum measurement. RSI moves between 0 and 100, tracking price momentum, while TSI oscillates between -100 and +100, measuring price trend strength.
By summing these oscillators, traders can get a total value ranging from -200 to +300, providing a more nuanced view of market momentum. When the indicator approaches +300, it suggests strong upward price movement, and when it nears -200, it indicates potential downward price trends.
Why it may be useful
This combined indicator offers traders a more comprehensive view of market momentum by integrating two different oscillator perspectives. By merging RSI and TSI, traders can gain deeper insights into potential price movements beyond what a single oscillator might reveal.
The holistic approach helps traders identify potential trend reversals and momentum shifts more effectively. It provides a broader context for market conditions, allowing traders to make more informed decisions about entry and exit points.
When to explore it
The TOTAL:(RSI+TSI) indicator works best in markets with clear momentum trends and during periods of significant price movement. It is particularly useful for traders seeking a comprehensive momentum assessment across different timeframes.
Traders should use this indicator in conjunction with other technical analysis tools to confirm signals and reduce false positives. It is most effective in volatile markets where rapid momentum shifts can provide profitable trading opportunities.
Keep exploring
What we’ve verified
Access, alerts and repainting behaviour have not been independently verified for this indicator. Check the creator’s current publication and settings.
General descriptions and classifications are recovered research. Verified details above identify the specific checks we have completed. Check the creator’s current publication for later changes.