A multi-stock tracking tool that allows investors to monitor portfolio performance, calculate total value, track daily price movements, and visualize profit or loss in real-time.
Explore complementary indicator rolesHow it works
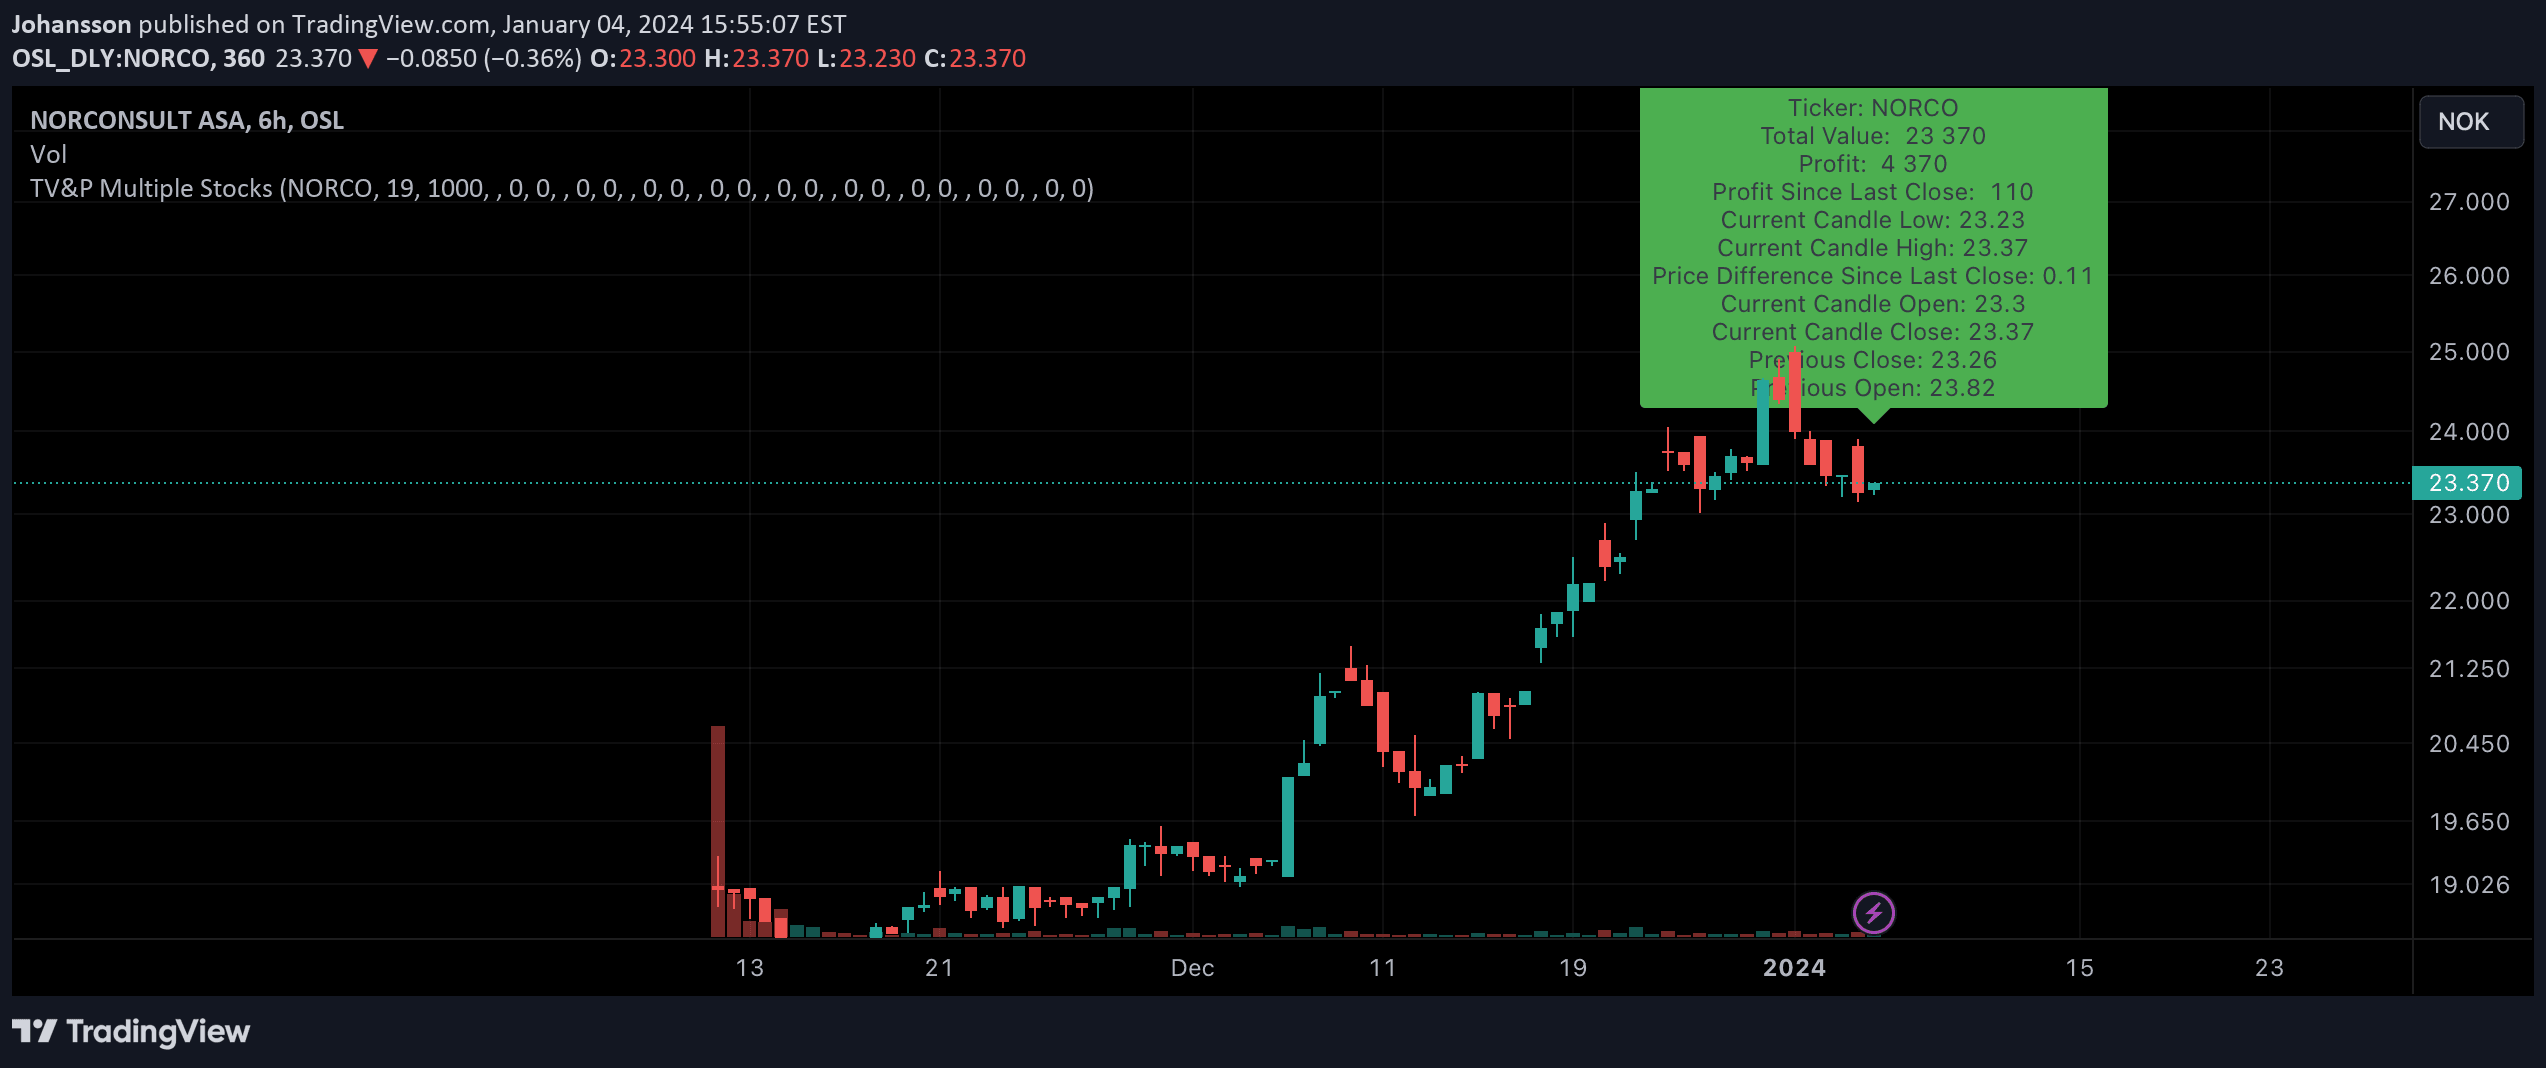
The code enables traders to input detailed information about up to 10 different stocks, including their stock symbols, purchase prices, and the number of shares owned. It then calculates the total value of each stock holding by multiplying the current market price by the number of shares, providing a real-time snapshot of portfolio performance.
Additionally, the script tracks daily price movements, displaying the lowest and highest prices for the current trading session and calculating the price difference since the last closing. The generated labels are color-coded to indicate profit or loss, with green representing gains and red representing losses, making it easy for traders to quickly assess their investments.
Why it may be useful
This portfolio tracking tool is crucial for investors as it provides a comprehensive and instant overview of their stock holdings, allowing them to make informed decisions based on real-time data. By presenting complex financial information in a visually intuitive manner, the code helps traders quickly understand their portfolio's performance without manual calculations.
The color-coded visualization and comprehensive tracking mechanism enable investors to rapidly identify which stocks are performing well and which might require attention or potential reallocation. This immediate insight supports more efficient risk management and helps traders develop more strategic investment approaches based on current market dynamics.
When to explore it
This tracking tool is most beneficial for active investors who manage multiple stock positions and require frequent, detailed performance insights. It is particularly useful during volatile market conditions when rapid assessment of portfolio performance can help make timely investment decisions.
Traders who regularly monitor their investments and want a quick, visual representation of their portfolio's health will find this tool most valuable. It is especially helpful for day traders and swing traders who need to make quick, data-driven decisions about their stock holdings and want to minimize time spent on manual portfolio analysis.
Keep exploring
What we’ve verified
Access, alerts and repainting behaviour have not been independently verified for this indicator. Check the creator’s current publication and settings.
General descriptions and classifications are recovered research. Verified details above identify the specific checks we have completed. Check the creator’s current publication for later changes.