
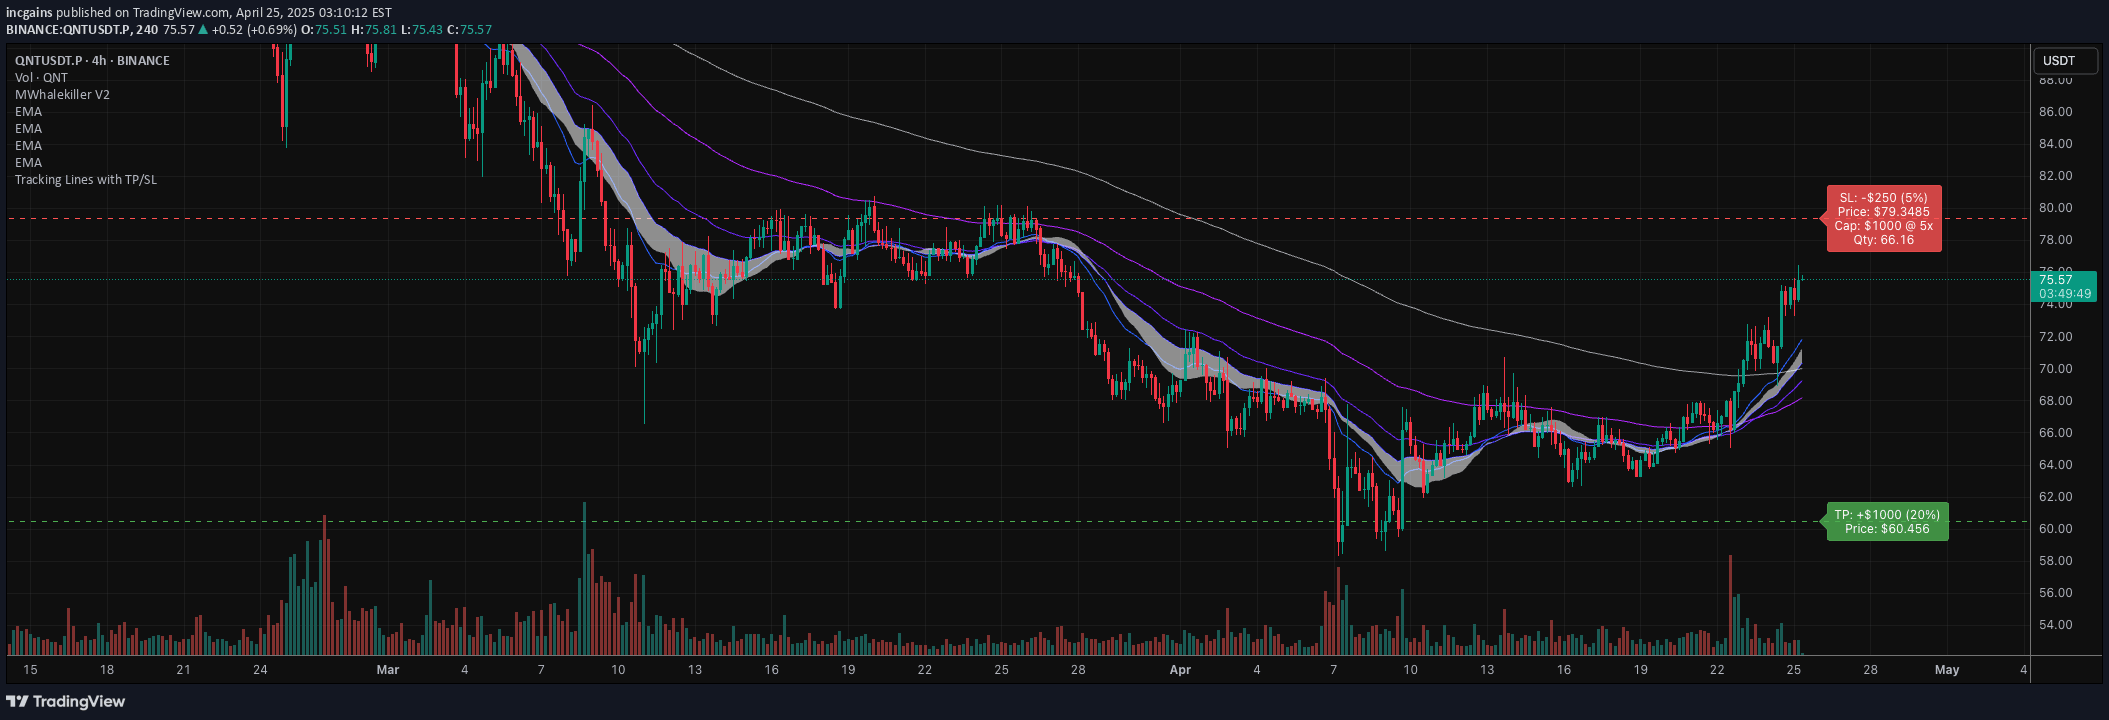
A trading visual indicator that helps traders set take profit and stop loss levels with visual lines and calculate trading capital requirements for precise market entries.
Explore complementary indicator rolesHow it works
The indicator generates visual red and green lines on the trading chart to represent potential take profit and stop loss levels for traders. These lines help traders quickly understand their potential risk and reward zones within the current market context.
By integrating capital and leverage calculations, the tool automatically determines the number of tokens required to meet specific trading capital requirements. This provides traders with an immediate visual representation of their potential trade parameters and helps them make more informed entry decisions.
Why it may be useful
Visual trading indicators like this help traders quickly assess market entry points and potential risk scenarios without complex manual calculations. By presenting stop loss and take profit levels directly on the chart, traders can make faster and more intuitive trading decisions.
The integration of capital and leverage calculations provides traders with a comprehensive view of their potential trade, reducing the cognitive load of manual computation. This streamlines the decision-making process and helps traders maintain a more disciplined and strategic approach to market entries.
When to explore it
This indicator is most effective during volatile market conditions where precise entry and exit points are crucial for managing risk. Traders can use it across various timeframes, particularly in fast-moving markets where quick visual assessment is necessary.
It is especially useful for scalpers and day traders who need rapid visual feedback on potential trade parameters. By providing an instant view of stop loss and take profit levels, traders can make more informed decisions in high-speed trading environments.
Keep exploring
What we’ve verified
Access, alerts and repainting behaviour have not been independently verified for this indicator. Check the creator’s current publication and settings.
General descriptions and classifications are recovered research. Verified details above identify the specific checks we have completed. Check the creator’s current publication for later changes.


