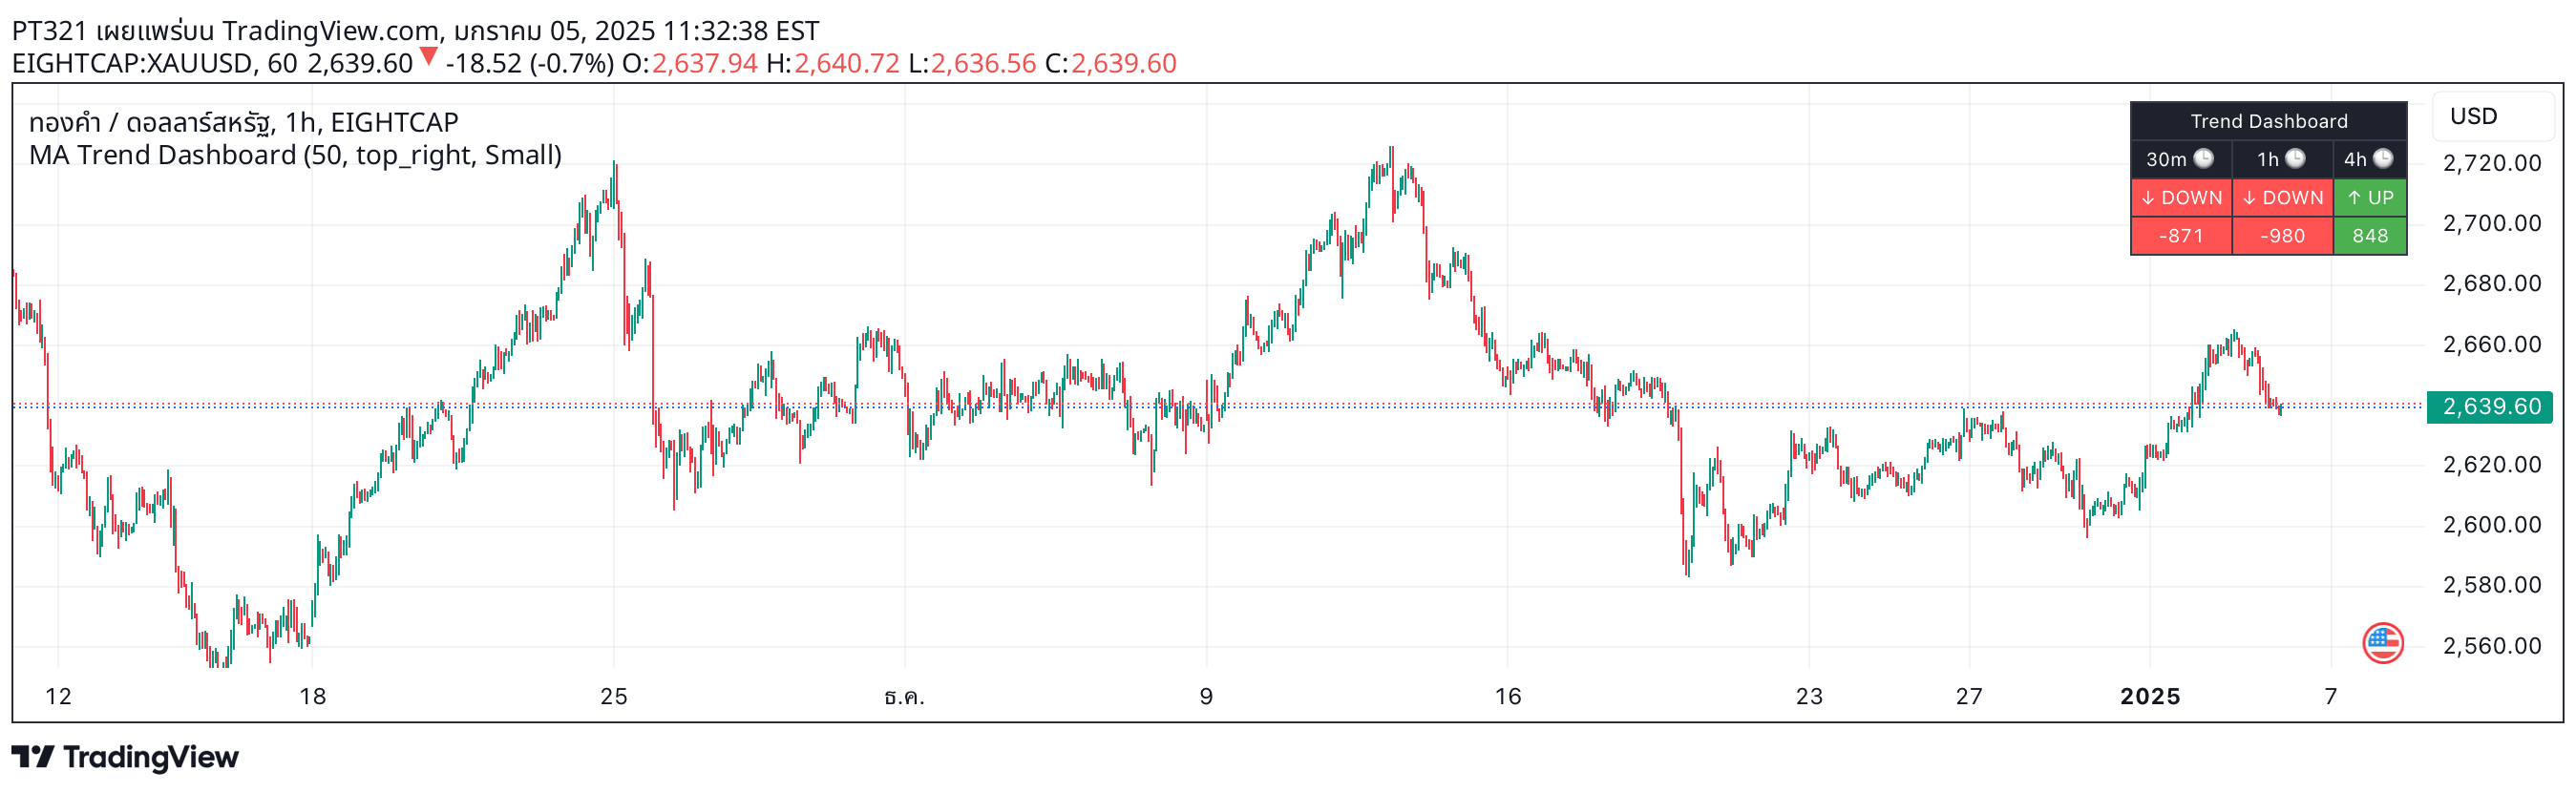
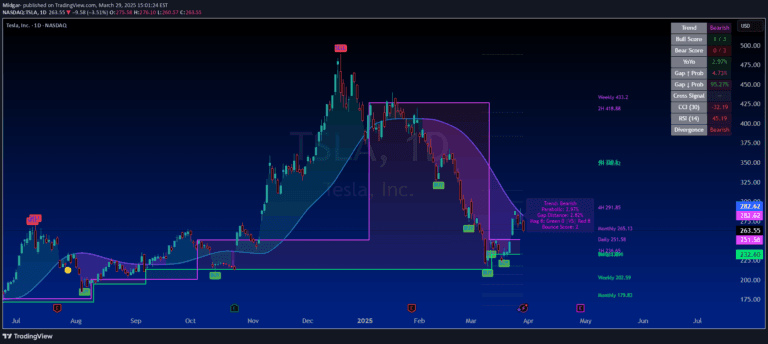
Trend Degree Dashboard calculates market slope using linear regression, displaying trend angle in degrees to quickly visualize market direction and momentum.
Explore complementary indicator rolesHow it works
The indicator uses linear regression to calculate the trend angle by measuring the slope between consecutive price points over a specified lookback period. It applies mathematical transformation using the arctangent function to convert the slope into a geometric angle representation.
By default, the calculation uses closing prices over 21 bars, but traders can customize the source (close, open, high, low) and lookback period. The resulting angle provides a direct visual representation of market momentum, with positive angles indicating uptrends and negative angles signaling downtrends.
Why it may be useful
Trend Degree Dashboard offers traders a quick, intuitive way to understand market direction without complex interpretation. The angle measurement provides an immediate visual cue about market momentum, allowing traders to rapidly assess whether prices are moving upward or downward.
By presenting trend information in a clean, color-coded dashboard, the indicator simplifies technical analysis and helps traders make faster decisions. The non-repainting nature ensures reliability, while the lightweight design maintains chart performance and readability.
When to explore it
This indicator works best in trending markets where clear directional movement is present. Traders can use it across multiple timeframes, from scalping to swing trading, to quickly identify and confirm trend strength and direction.
It is particularly useful during periods of sustained price movement, helping traders align their strategies with the current market trend. The customizable lookback period allows adaptation to different market conditions and trading styles, making it a versatile tool for technical analysis.
Keep exploring
What we’ve verified
Access, alerts and repainting behaviour have not been independently verified for this indicator. Check the creator’s current publication and settings.
General descriptions and classifications are recovered research. Verified details above identify the specific checks we have completed. Check the creator’s current publication for later changes.