
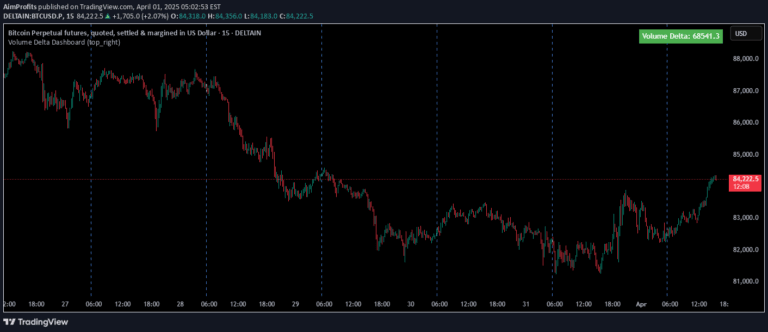
Volume Delta Dashboard
A Volume Delta Dashboard that analyzes buying and selling pressure by comparing volume across price bars, helping traders understand market sentiment and potential price movements.
Explore 11,183 indicators. Filter beyond the obvious.
Discover the tools that fit the way you trade.
11,183 tools to explore
A Volume Delta Dashboard that analyzes buying and selling pressure by comparing volume across price bars, helping traders understand market sentiment and potential price movements.
A visual tool that identifies rare candlestick patterns with no wicks, revealing strong directional price movements with complete buying or selling pressure.
Trend Degree Dashboard calculates market slope using linear regression, displaying trend angle in degrees to quickly visualize market direction and momentum.
Likes, views, and comments are historical TradingView snapshots. They describe attention, not trading performance.