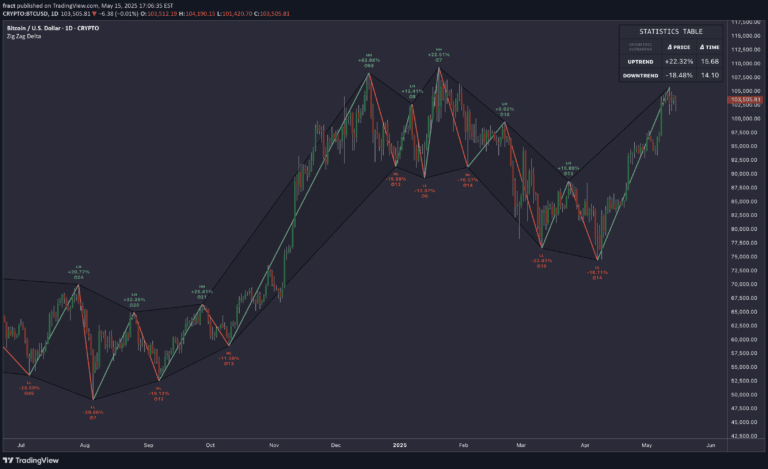
A trend prediction indicator using pull back structures to determine market direction by analyzing price movement and candle relationships with precise measurements.
Explore complementary indicator rolesHow it works
This indicator identifies trend direction by analyzing pull back structures in price movement. It focuses on tracking price changes where the direction switches and closes either above or below the previous candle's open. For an uptrend, the system looks for bullish pull backs that do not breach the previous low, and then confirms the trend when price moves above the pull back's start point.
In a downtrend scenario, the indicator examines bearish pull backs that do not exceed the previous high. The trend is confirmed when the price drops below the pull back's starting point. This method provides a systematic approach to trend identification by using precise candle measurements and directional changes.
Why it may be useful
Trend identification is crucial for traders seeking to understand market momentum and potential price movements. By providing a structured method of analyzing price action, this indicator helps traders make more informed decisions about entry and exit points. It offers a nuanced approach to trend detection that goes beyond simple moving averages or linear trend lines.
The indicator's strength lies in its ability to capture subtle market dynamics through pull back structures. It can help traders recognize potential trend reversals earlier than traditional methods, potentially improving trade timing and reducing false signals. This approach provides a more dynamic and responsive way of interpreting market trends.
When to explore it
This trend indicator is most effective in markets with clear directional movements and sufficient price volatility. It works particularly well in liquid markets like forex, stocks, and major cryptocurrency pairs where price action is more predictable. Traders should use this signal in timeframes that allow for clear pull back structures, typically ranging from 1-minute to daily charts.
The indicator is especially useful during trending market conditions, where price is showing consistent directional movement. It may be less reliable in choppy or highly erratic market environments. Traders should combine this signal with other technical and fundamental analysis tools to confirm trend predictions and reduce potential false signals.
Keep exploring
What we’ve verified
Access, alerts and repainting behaviour have not been independently verified for this indicator. Check the creator’s current publication and settings.
General descriptions and classifications are recovered research. Verified details above identify the specific checks we have completed. Check the creator’s current publication for later changes.