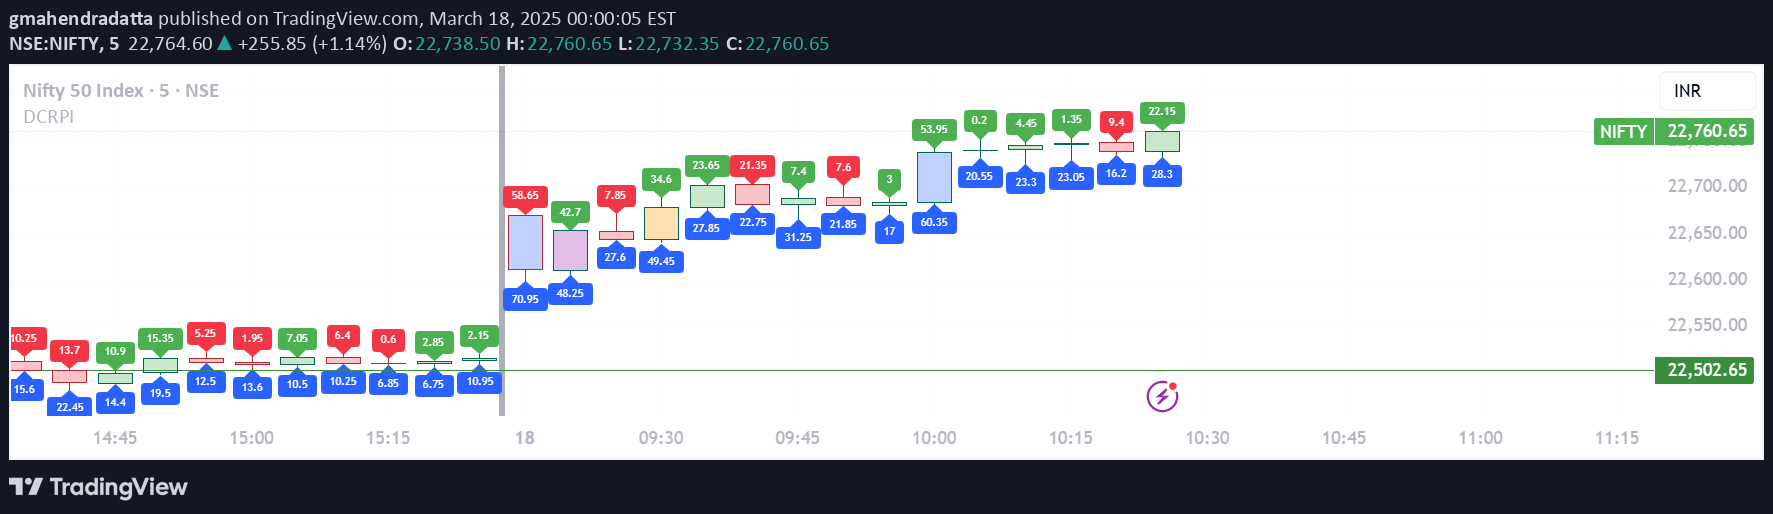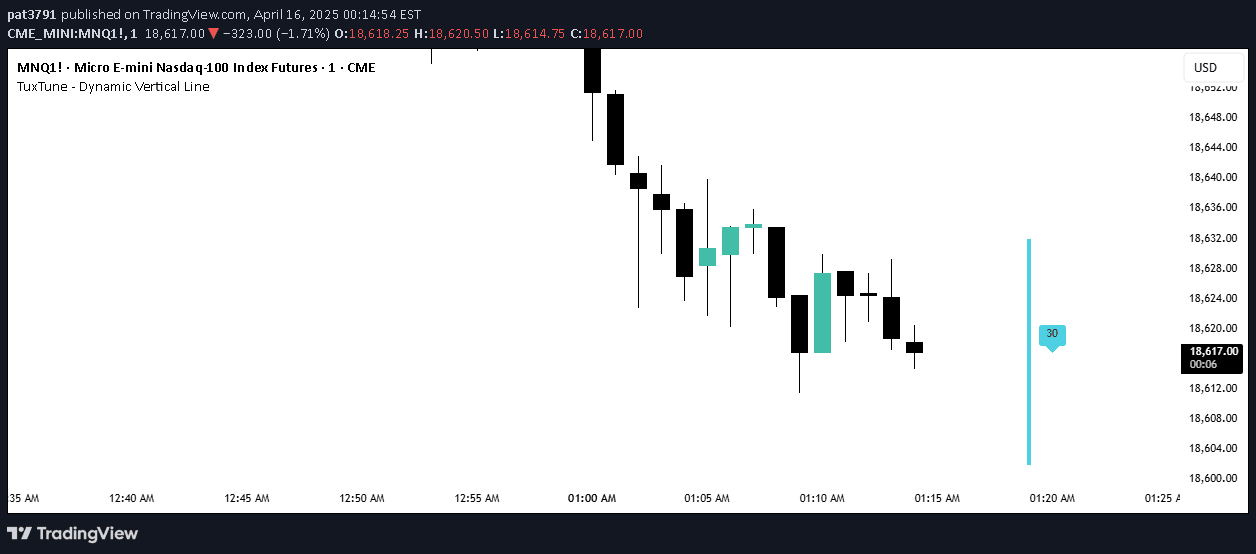
A dynamic vertical line indicator that helps traders quickly visualize price movement and candle size by adjusting its height, width, color, and positioning on the chart.
Explore complementary indicator rolesHow it works
The vertical line dynamically tracks the latest candle in the selected time frame, with its middle point aligned with the most recent price. Traders can customize the line's range, height, and width to provide a quick visual reference for candle size and price movement. By adjusting the line's parameters, users can create a personalized visual aid that helps them quickly assess market conditions without constantly referencing numerical axis values.
The indicator's flexibility allows traders to set the line's distance from the last candle, modify its color for better visibility, and toggle the label on or off. This customization enables traders to create a visual tool that suits their individual trading style and preferences, making it easier to interpret price action and market dynamics at a glance.
Why it may be useful
Visual indicators like this vertical line help traders quickly process market information by providing an intuitive, at-a-glance representation of price movement and candle characteristics. By offering a customizable visual aid, the indicator reduces the cognitive load of analyzing charts, allowing traders to make faster and more informed decisions. The ability to adjust the line's parameters means traders can create a personalized tool that highlights the most important aspects of price action for their specific trading strategy.
The indicator's adaptability makes it valuable across different trading styles and timeframes, particularly for traders who rely on quick visual assessments of market conditions. By providing an immediate, visual representation of price movement, the indicator can help traders identify potential trends, volatility changes, and market dynamics more efficiently than traditional numerical analysis.
When to explore it
This vertical line indicator is most effective during periods of active market movement, such as during volatile trading sessions or when significant price changes are occurring. Traders can use it to quickly gauge the size and momentum of recent price candles, making it particularly useful for short-term trading strategies like scalping and day trading. The indicator's customizable nature allows traders to adapt it to different market conditions and asset classes, providing a versatile tool for visual market analysis.
The indicator works best when combined with other technical analysis tools and indicators, serving as a complementary visual aid to help traders make more informed decisions. It is especially useful for traders who prefer visual representations of market data and those who want to quickly assess price action without getting bogged down in detailed numerical analysis. By providing a simple, customizable way to visualize price movement, the indicator can help traders improve their market perception and decision-making speed.
Keep exploring
What we’ve verified
Access, alerts and repainting behaviour have not been independently verified for this indicator. Check the creator’s current publication and settings.
General descriptions and classifications are recovered research. Verified details above identify the specific checks we have completed. Check the creator’s current publication for later changes.