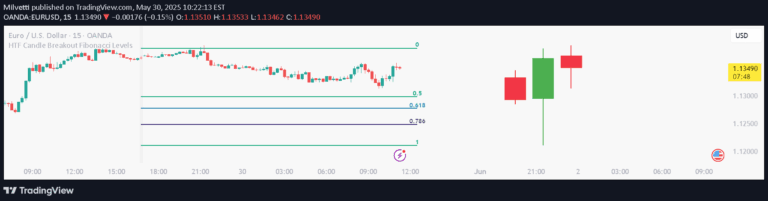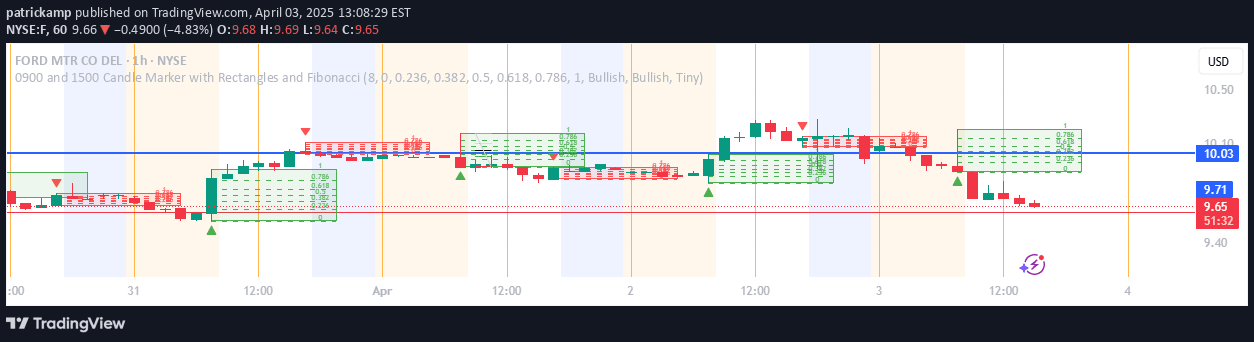
A TradingView tool that marks key market times with colored rectangles and Fibonacci levels, helping traders visualize important trading moments and price ranges throughout the day.
Explore complementary indicator rolesHow it works
The indicator automatically draws a green rectangle at 9:00 AM and a red rectangle at 3:00 PM based on Eastern Time. It adds dashed Fibonacci lines inside these rectangles to highlight specific price levels like 0.236 and 0. 618.
The tool calculates the rectangle's height and places corresponding number labels on each Fibonacci line. It adapts to different chart types including stocks, crypto, and futures. The indicator works best on shorter timeframes where individual candles are clearly visible
Why it may be useful
Traders benefit from this tool by gaining visual insights into critical market timing and potential price movement zones. The Fibonacci levels provide quick reference points for potential support and resistance areas during key trading hours.
By marking important time periods, traders can better prepare for market open and afternoon trading sessions. The color-coded rectangles help quickly identify significant market periods without manual drawing. The customizable settings allow traders to adapt the indicator to their specific trading style and preferences
When to explore it
This indicator is most effective for day traders focusing on short-term trading opportunities. It works best on 1-hour or shorter timeframes like 30-minute, 15-minute, 5-minute, or 1-minute charts. Traders can utilize it during active market hours, particularly for stocks, cryptocurrencies, and futures.
The tool is especially useful for those tracking morning market opens and afternoon trading shifts. It provides valuable visual cues for traders monitoring intraday price movements and looking for potential entry or exit points
Keep exploring
What we’ve verified
Access, alerts and repainting behaviour have not been independently verified for this indicator. Check the creator’s current publication and settings.
General descriptions and classifications are recovered research. Verified details above identify the specific checks we have completed. Check the creator’s current publication for later changes.