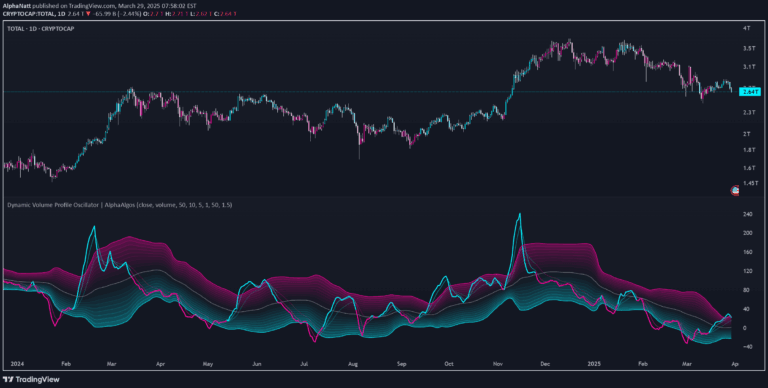
The Unmitigated Liquidity Imbalance Indicator analyzes market dynamics by detecting liquidity shifts between bullish and bearish conditions using advanced candlestick analysis.
Explore complementary indicator rolesHow it works
The indicator operates by examining the size and direction of candlesticks to identify potential market sentiment shifts. It compares the current candle's characteristics with previous candles, tracking changes in length and direction to detect liquidity imbalances between bulls and bears.
By analyzing these candlestick variations, the tool calculates a threshold that indicates market conditions. When the oscillator reading is above 0.5, it suggests bullish sentiment, while readings below 0.5 point to bearish market conditions, helping traders understand potential trend movements.
Why it may be useful
The Unmitigated Liquidity Imbalance Indicator provides traders with a sophisticated method to understand market dynamics beyond traditional price analysis. By revealing hidden liquidity patterns, it offers insights into potential market sentiment shifts that might not be immediately apparent from raw price data.
Traders can leverage this tool to make more informed decisions, identifying potential entry and exit points with greater precision. The indicator's ability to detect subtle market changes can help traders anticipate trend reversals and adjust their strategies accordingly.
When to explore it
This indicator is most effective in markets with clear directional movements and significant liquidity variations. It performs best in timeframes that allow for detailed candlestick analysis, such as short to medium-term trading intervals where market sentiment can quickly change.
Traders should use the Unmitigated Liquidity Imbalance Indicator in conjunction with other technical analysis tools to confirm signals and reduce false positives. It is particularly useful during periods of market volatility, where rapid sentiment shifts can present significant trading opportunities.
Keep exploring
What we’ve verified
Access, alerts and repainting behaviour have not been independently verified for this indicator. Check the creator’s current publication and settings.
General descriptions and classifications are recovered research. Verified details above identify the specific checks we have completed. Check the creator’s current publication for later changes.