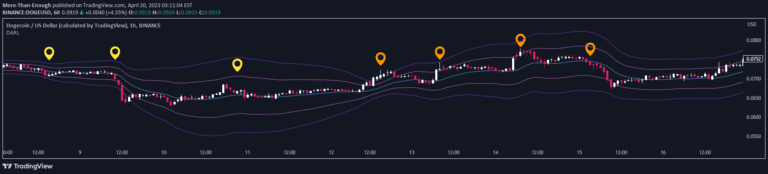
A technical analysis tool using moving averages and Bollinger Bands to identify market trends, highlighting bullish and bearish conditions through price and moving average interactions.
Explore complementary indicator rolesHow it works
The indicator calculates a 50-period simple moving average (SMA) to establish the baseline trend direction and an 8-period exponential moving average (EMA) for more responsive price tracking. Bollinger Bands are plotted two standard deviations above and below the SMA, creating a dynamic volatility envelope that captures approximately 95% of price movements.
When the closing price crosses above or below the SMA50, the indicator changes background colors to visually signal bullish or bearish market conditions. The EMA line's interaction with the SMA provides additional trading signals, with crossovers indicating potential entry or exit points for traders seeking trend momentum.
Why it may be useful
This indicator provides traders with a comprehensive visual representation of market dynamics, helping them quickly interpret complex price movements and trend directions. By combining multiple technical analysis tools like moving averages and Bollinger Bands, it offers a nuanced view of market sentiment and potential trend reversals.
The color-coded background and multiple moving average lines allow traders to rapidly assess market conditions, reducing the complexity of technical analysis. It helps traders identify potential trading opportunities by highlighting critical price relationships and volatility patterns that might otherwise be difficult to recognize.
When to explore it
The indicator is most effective in markets with clear trending characteristics, where price movements show consistent directional momentum. It works well across various timeframes, making it suitable for scalpers, day traders, and swing traders looking to capture short to medium-term price movements.
Traders should use this indicator in conjunction with other technical and fundamental analysis tools to confirm signals and reduce false positives. It is particularly useful during periods of moderate market volatility, where moving average crossovers and Bollinger Band interactions can provide meaningful insights into potential trading opportunities.
Keep exploring
What we’ve verified
Access, alerts and repainting behaviour have not been independently verified for this indicator. Check the creator’s current publication and settings.
General descriptions and classifications are recovered research. Verified details above identify the specific checks we have completed. Check the creator’s current publication for later changes.