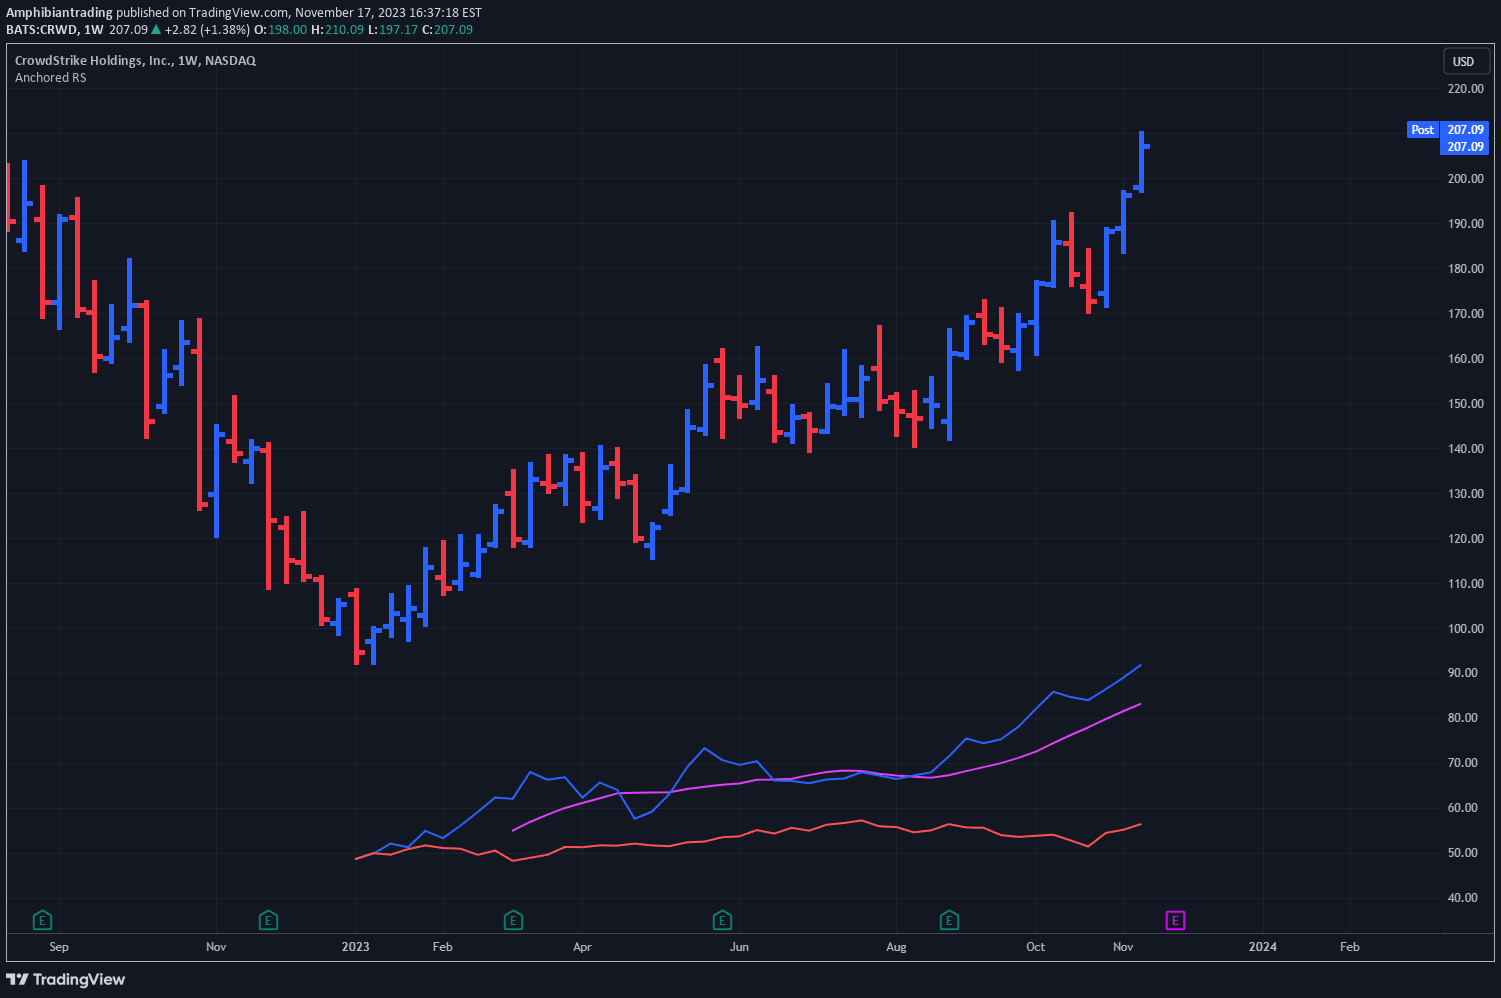
The Urika Directional Strength indicator evaluates trend direction and strength by analyzing price data through moving averages and standard deviation calculations.
Explore complementary indicator rolesHow it works
The Urika Directional Strength (UDS) indicator calculates trend direction using Simple Moving Average and standard deviation of price data. It establishes upper and lower directional bands by adding and subtracting the product of standard deviation and a multiplier from the moving average.
The indicator then determines directional trends by computing the absolute difference between price data and these bands, divided by the standard deviation multiplier. This process allows traders to visually understand the current market trend's strength and potential momentum shifts.
Why it may be useful
The UDS indicator provides traders with a comprehensive view of market trends by simultaneously measuring both direction and strength. It helps traders distinguish between strong, persistent trends and weak, consolidating market conditions, enabling more informed trading decisions.
By offering visual representations of trend dynamics, the indicator reduces subjective interpretation and provides a systematic approach to trend analysis. Traders can quickly assess whether a market is trending strongly, preparing to reverse, or currently consolidating.
When to explore it
The Urika Directional Strength indicator is most effective in markets with clear trending characteristics, such as forex, stocks, and commodities. It performs best during periods of consistent price movement, helping traders identify and confirm trend strength across multiple timeframes.
Traders should use this indicator in conjunction with other technical analysis tools to validate signals and reduce false positives. It is particularly useful when combined with volume indicators and momentum oscillators to provide a more comprehensive market analysis.
Keep exploring
What we’ve verified
Access, alerts and repainting behaviour have not been independently verified for this indicator. Check the creator’s current publication and settings.
General descriptions and classifications are recovered research. Verified details above identify the specific checks we have completed. Check the creator’s current publication for later changes.