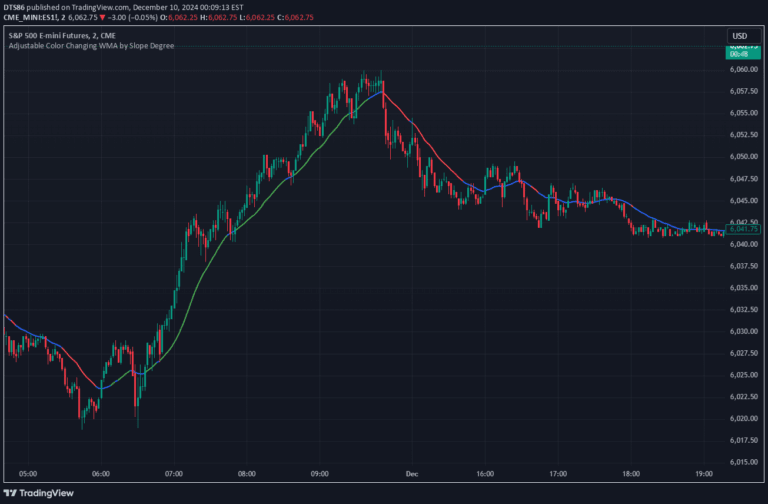
A dynamic EMA indicator with color-changing trend visualization and customizable range selector, offering traders enhanced insights into market trends and potential price channels.
Explore complementary indicator rolesHow it works
The indicator calculates an Exponential Moving Average (EMA) using a user-defined length and source price. As the EMA line is plotted, its color dynamically changes based on the slope of the trend - blue for upward, red for downward, and gray for sideways movement.
A secondary mirrored line is plotted at a user-specified percentage distance from the primary EMA, creating a visual range or channel. This allows traders to quickly identify potential support and resistance zones while simultaneously monitoring the market's directional momentum.
Why it may be useful
Traditional moving average indicators often lack visual clarity and contextual insights about market trends. This enhanced EMA tool provides immediate trend recognition through color coding, allowing traders to quickly understand market direction without complex analysis.
The customizable range selector adds an extra dimension of analysis, enabling traders to identify potential price channels and support/resistance zones more intuitively. By combining trend visualization with range identification, traders can develop more nuanced trading strategies and make more informed decisions.
When to explore it
This indicator is most effective in markets with clear trending or ranging conditions, where price movements are relatively consistent and directional. It works particularly well in liquid markets like forex, stocks, and major cryptocurrency pairs where trend identification is crucial for successful trading.
Traders should use this tool across multiple timeframes, from short-term scalping to longer-term swing trading strategies. The customizable inputs allow adaptation to different market conditions, making it versatile for various trading styles and risk management approaches.
Keep exploring
What we’ve verified
Access, alerts and repainting behaviour have not been independently verified for this indicator. Check the creator’s current publication and settings.
General descriptions and classifications are recovered research. Verified details above identify the specific checks we have completed. Check the creator’s current publication for later changes.