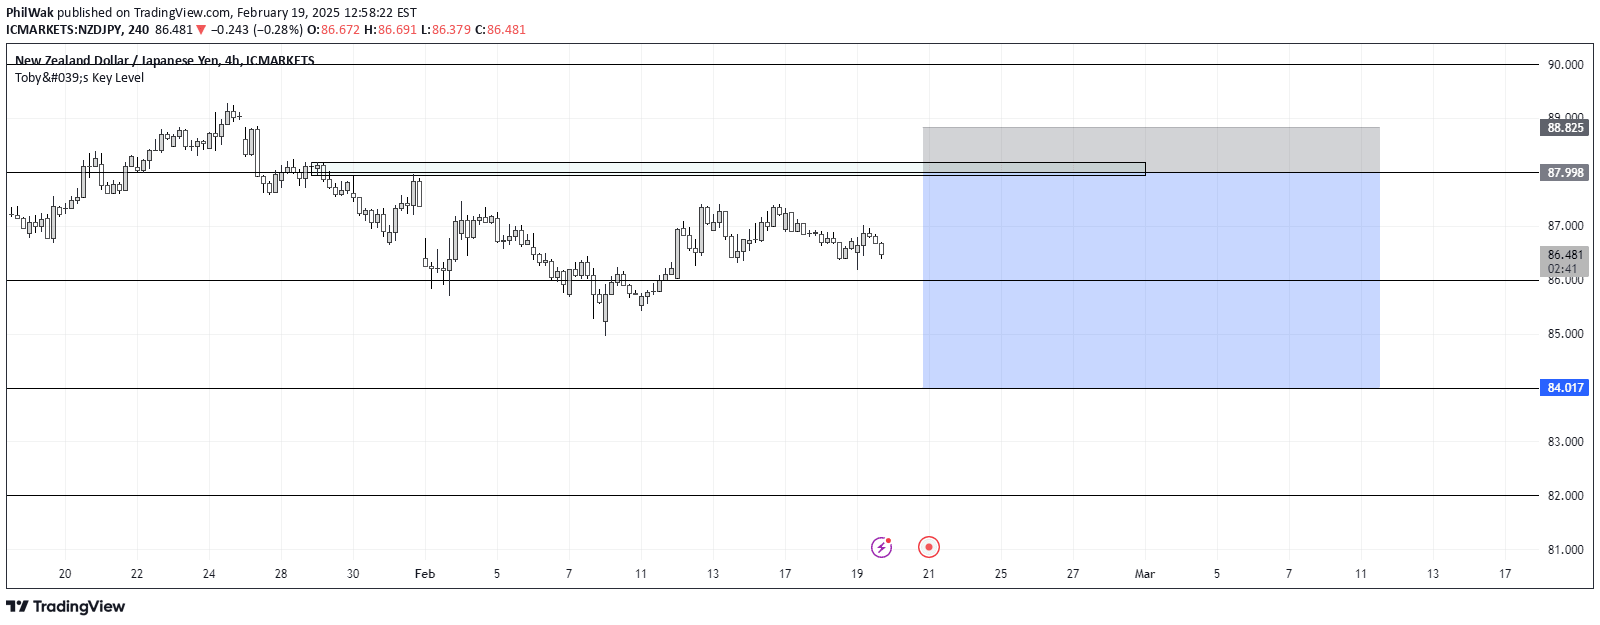
A Trading View indicator that displays key price levels from previous time periods, helping traders identify potential support and resistance areas across daily, weekly, and monthly timeframes.
Explore complementary indicator rolesHow it works
The UTS Chronos Levels indicator automatically calculates and plots key price levels from previous time periods using the ta.change() function to detect new days, weeks, and months. It creates horizontal lines representing the high and low points for each period, with specific color coding to distinguish between different timeframe levels.
The script uses persistent variables to store the start points of periods and manages line objects efficiently. It redraws lines on each last bar to prevent chart overcrowding and ensure the most up-to-date information is displayed for traders.
Why it may be useful
These predefined price levels provide traders with crucial reference points for understanding market structure and potential price reaction zones. By visualizing previous period highs and lows, traders can quickly identify key support and resistance areas that might influence future price movements.
The multi-timeframe approach allows traders to gain a comprehensive view of price dynamics across different time horizons. This holistic perspective helps in making more informed trading decisions by revealing potential entry, exit, and stop-loss points based on historical price interactions.
When to explore it
The UTS Chronos Levels indicator is most effective during trending and range-bound market conditions where historical price levels play a significant role in determining market sentiment. Traders can use these levels to identify potential breakout or rejection points, especially when price approaches previous high or low levels.
This indicator is particularly useful for traders who employ multi-timeframe analysis and want a quick visual reference for key price levels. It can be especially valuable during periods of market consolidation or when seeking to understand the broader market context beyond the current trading session.
Keep exploring
What we’ve verified
Access, alerts and repainting behaviour have not been independently verified for this indicator. Check the creator’s current publication and settings.
General descriptions and classifications are recovered research. Verified details above identify the specific checks we have completed. Check the creator’s current publication for later changes.