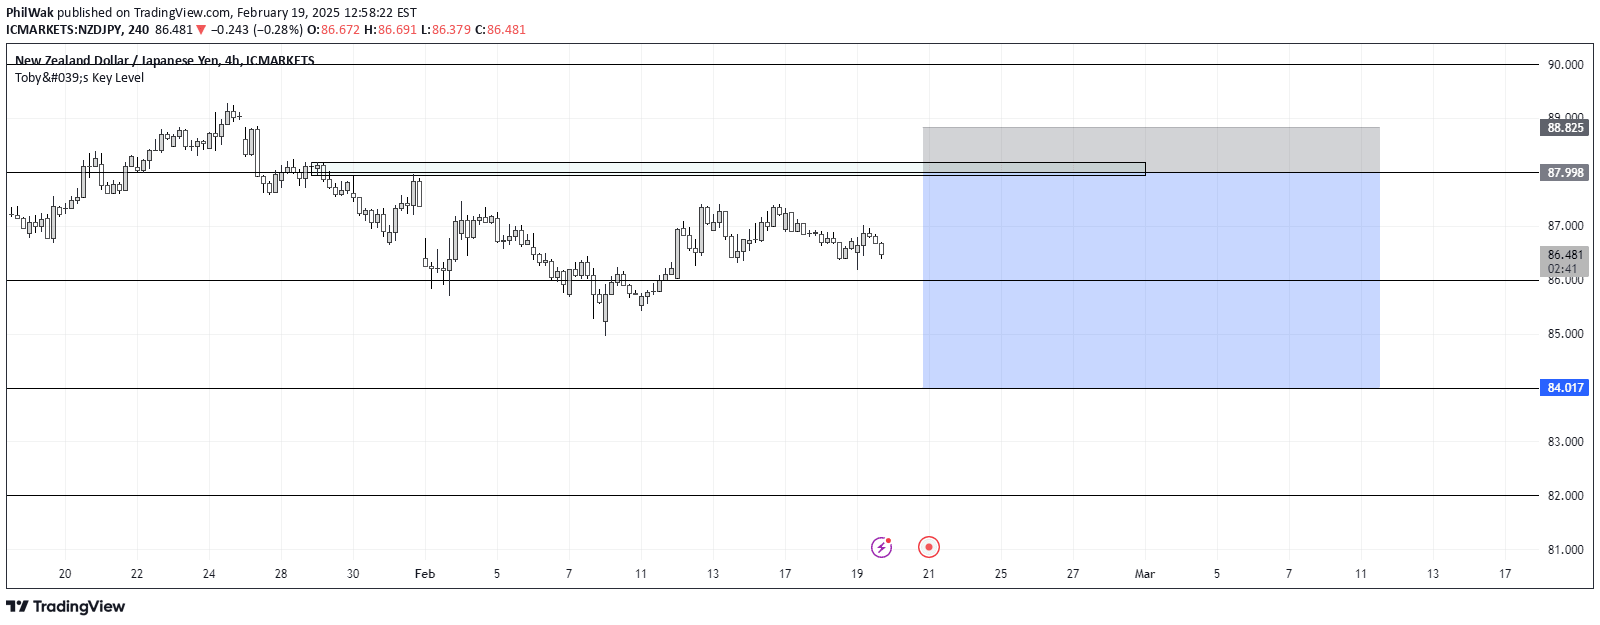
A customizable box drawing script for futures trading that allows traders to manually define zone levels for potential entry, mid, and exit points in the market.
Explore complementary indicator rolesHow it works
The box drawing script provides a manual method for traders to create custom zones on a price chart by inputting numerical values for start, middle, and end points. Traders can visually define key levels that represent potential buy, mid, and sell zones for their specific trading strategy. This tool allows for precise demarcation of important price regions that can serve as support, resistance, or transition areas.
By enabling traders to draw their own levels, the script offers flexibility in identifying potential entry and exit points based on individual market analysis. The numeric input method allows for quick and intuitive zone creation, making it adaptable to various trading styles and market conditions.
Why it may be useful
The box drawing script empowers traders with a visual and customizable approach to market analysis, allowing them to define their own strategic zones based on personal trading insights. It provides a flexible framework for identifying potential trade entry, management, and exit points, which can be crucial for risk management and decision-making.
By enabling manual zone creation, traders can adapt their strategy to different market environments and trading styles. This tool is particularly valuable for futures traders who require precise level identification and want to develop a systematic approach to market navigation. The ability to manually draw and adjust zones helps traders maintain discipline, track potential price movements, and create a structured framework for their trading decisions.
When to explore it
The box drawing script is most effective in markets with clear directional movements or when traders have identified specific price levels of interest through technical or fundamental analysis. It works well in volatile markets where precise entry and exit points can make a significant difference in trading performance. Traders can use this tool to mark potential support and resistance levels, breakout zones, or areas of potential price consolidation.
The script is particularly useful for futures traders who rely on technical analysis and want a customizable method for marking important price regions. It can be applied across various timeframes, from scalping to swing trading, and is especially beneficial in markets with repeatable price patterns or distinct trading ranges.
Keep exploring
What we’ve verified
Access, alerts and repainting behaviour have not been independently verified for this indicator. Check the creator’s current publication and settings.
General descriptions and classifications are recovered research. Verified details above identify the specific checks we have completed. Check the creator’s current publication for later changes.