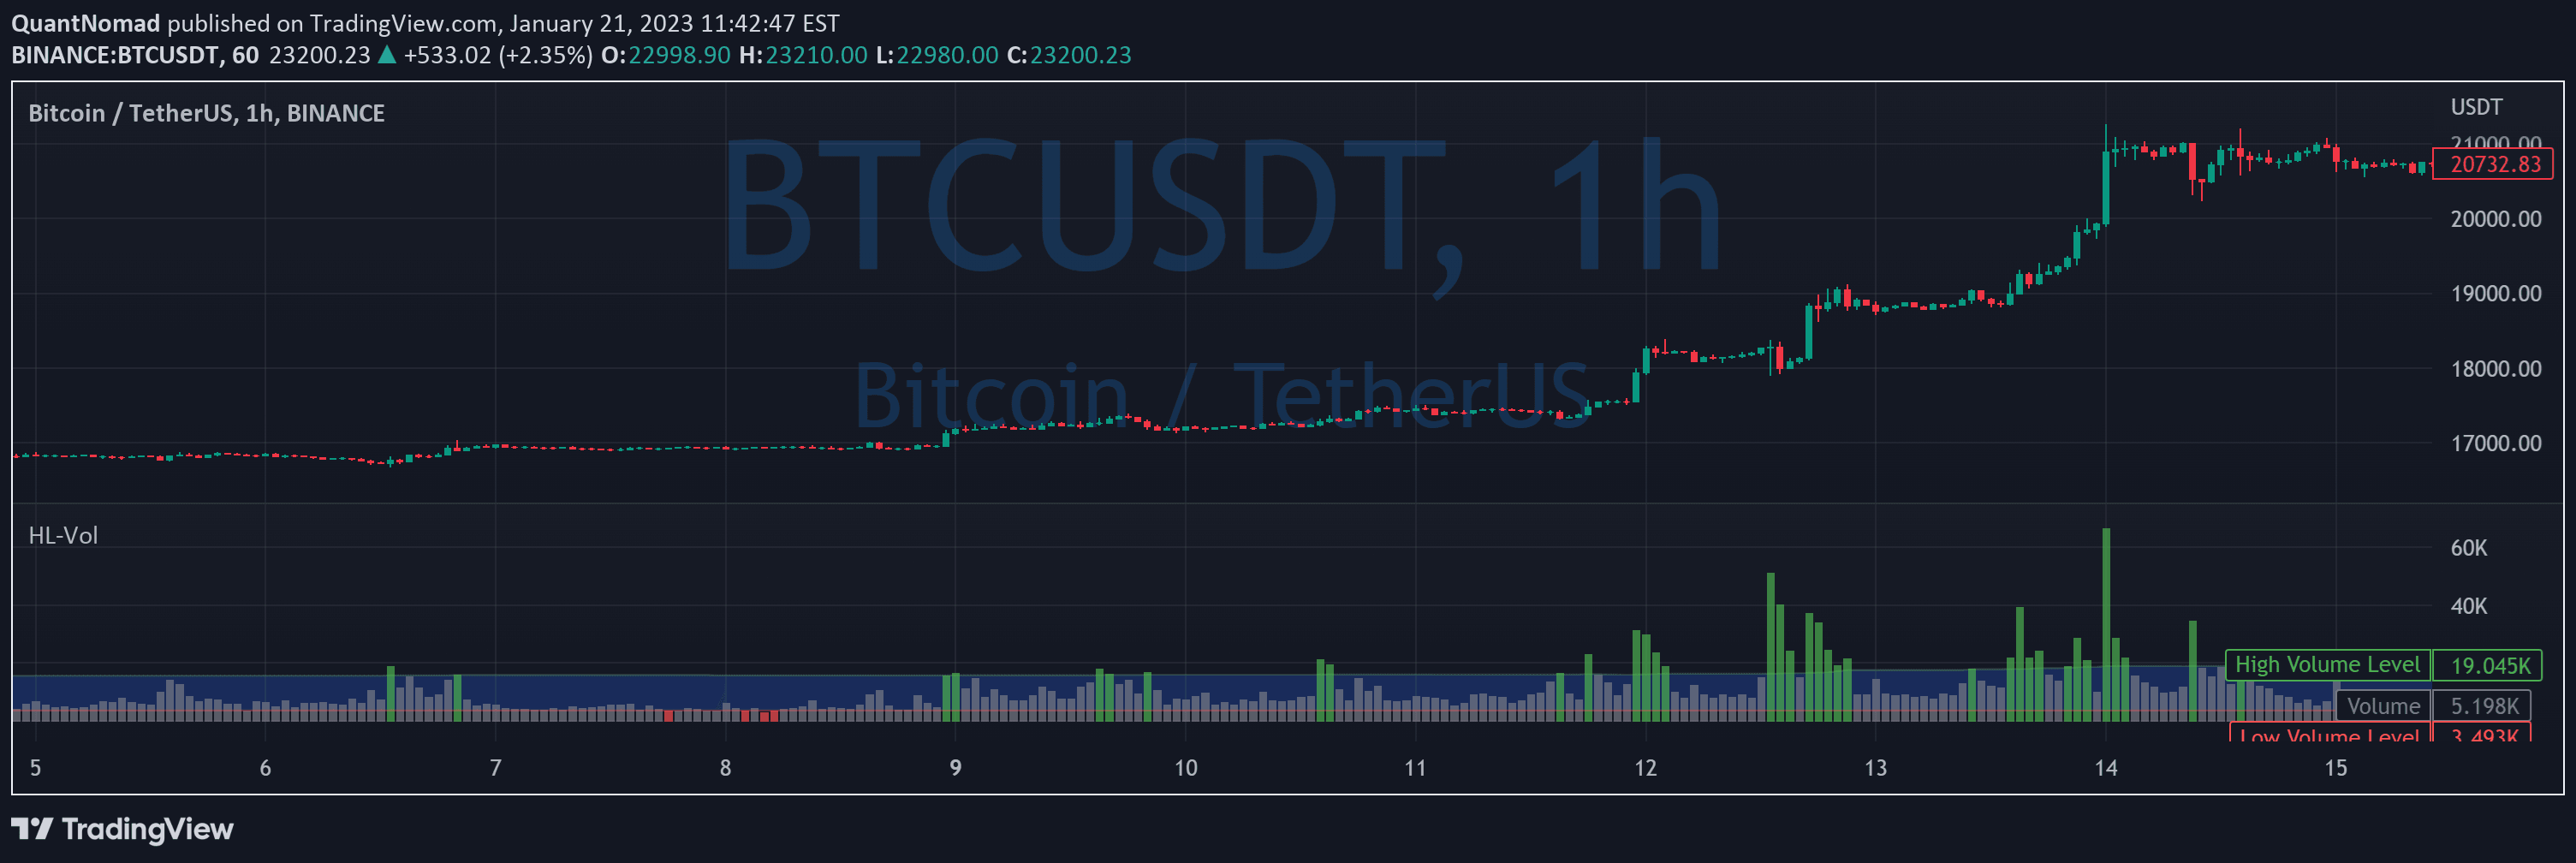
A volume analysis tool that visualizes buying and selling pressure within candlesticks, helping traders identify market sentiment and potential trend reversals through color-coded volume distribution.
Explore complementary indicator rolesHow it works
The volume buy/sell chart calculates total price movement within each candlestick by analyzing the relationship between opening and closing prices. It estimates buying and selling volume ratios based on whether the price closes higher or lower than its opening price, creating a dynamic assessment of market pressure.
The script then normalizes the buy and sell volume against the total volume, presenting it as a color-coded column chart. Green bars represent estimated buy volume, while red bars indicate estimated sell volume, providing traders with an intuitive visual representation of market sentiment and potential trading signals.
Why it may be useful
Understanding volume distribution is crucial for traders seeking to gauge market momentum and potential trend reversals. This tool offers a granular view of buying and selling pressure, allowing traders to identify hidden market dynamics that might not be apparent from price action alone.
By providing a clear, color-coded visualization of volume flow, traders can make more informed decisions about potential entry and exit points. The ability to set custom volume thresholds and receive alerts makes this indicator a powerful tool for identifying significant market movements and sentiment shifts.
When to explore it
The volume buy/sell chart is most effective during periods of high market activity and significant price movements. Traders can use this tool to confirm trend strength, identify potential reversals, and assess market sentiment across different timeframes and trading instruments.
It is particularly useful for active traders who require real-time insights into market dynamics, such as day traders and scalpers. The customizable features, including bar display options and volume percentage thresholds, make this indicator adaptable to various trading strategies and market conditions.
Keep exploring
What we’ve verified
Access, alerts and repainting behaviour have not been independently verified for this indicator. Check the creator’s current publication and settings.
General descriptions and classifications are recovered research. Verified details above identify the specific checks we have completed. Check the creator’s current publication for later changes.