
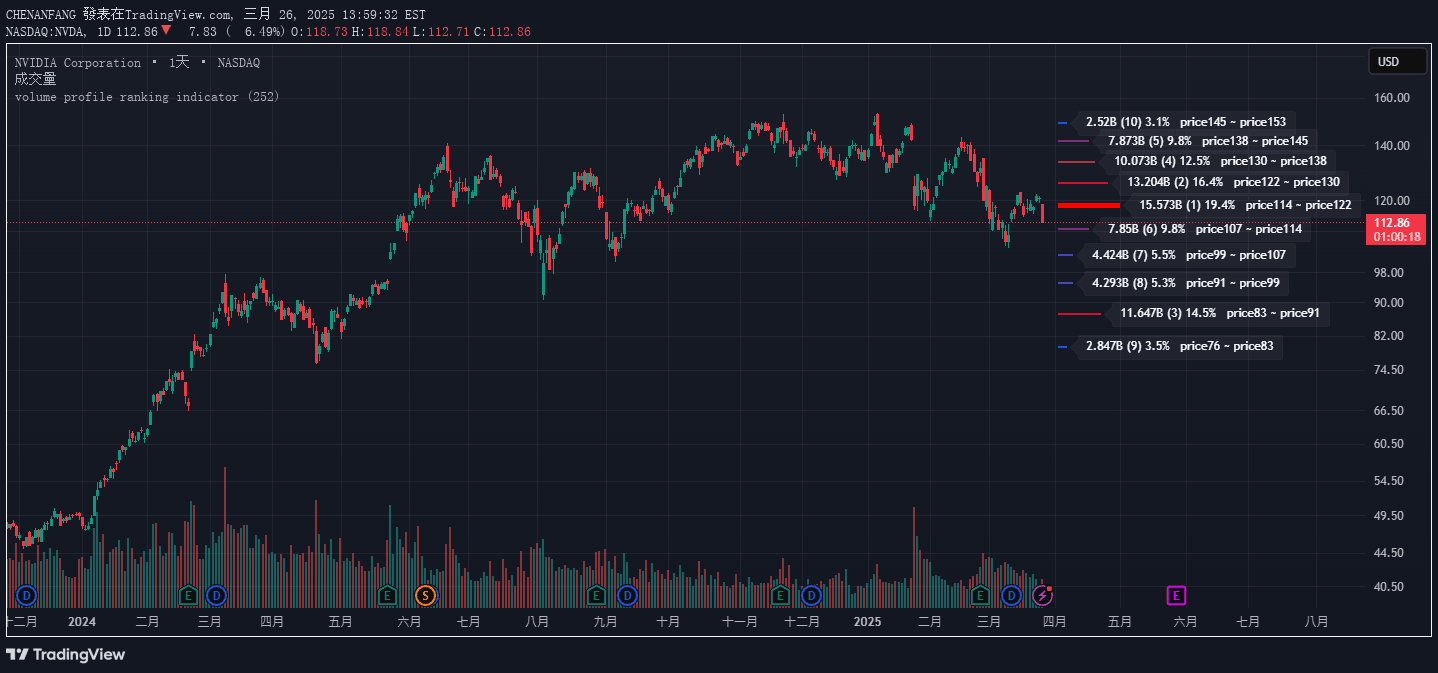
A custom volume profile indicator that visualizes trading volume distribution across price levels, allowing traders to identify key volume-based support and resistance zones dynamically.
Explore complementary indicator rolesHow it works
The volume profile indicator calculates volume distribution by dividing the price range into specified bins over a defined historical window. It tracks the total volume traded at each price level, sorting and ranking these levels using a bubble sort algorithm.
The script identifies the Point of Control (POC), which represents the price level with the most traded volume. By dynamically adjusting the lookback period and allowing custom date anchoring, traders can customize the volume analysis to suit their specific trading strategy
Why it may be useful
Volume profile provides critical insights into market dynamics by revealing where most trading activity occurs. It helps traders understand institutional and retail trader interest at different price levels.
By highlighting high-volume zones, traders can identify potential support and resistance areas, assess market sentiment, and make more informed trading decisions. The visual representation allows quick interpretation of volume concentration, helping traders gauge potential trend continuation or reversal points
When to explore it
This volume profile is most effective in markets with consistent trading volume and clear price trends. It works best for analyzing liquid instruments like major stock indices, forex pairs, and heavily traded commodities.
Traders should use it when seeking to understand market structure, identify potential entry and exit points, and confirm trend strength. It is particularly useful during ranging markets, when volume distribution can reveal key price levels where traders are most active
Keep exploring
What we’ve verified
Access, alerts and repainting behaviour have not been independently verified for this indicator. Check the creator’s current publication and settings.
General descriptions and classifications are recovered research. Verified details above identify the specific checks we have completed. Check the creator’s current publication for later changes.


