
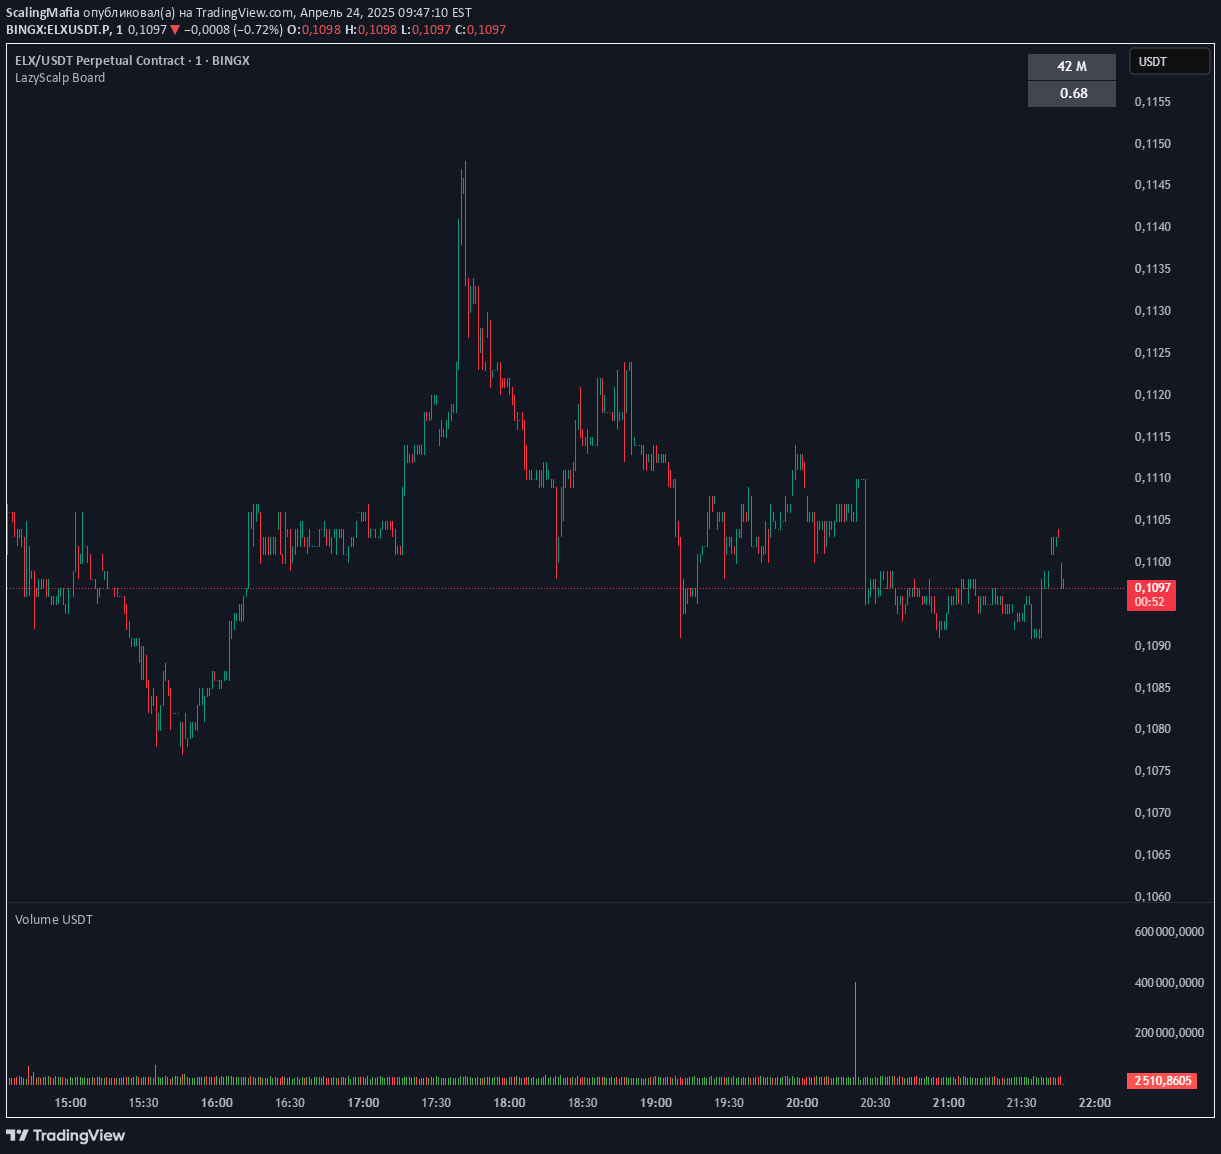
A volume indicator that measures traded value by multiplying candle volume with average price, providing color-coded insights into market direction and trading activity.
Explore complementary indicator rolesHow it works
The USDT Volume Bars indicator calculates traded value by multiplying each candle's volume with the average of its open and close prices. This approach provides a more accurate representation of actual trading activity beyond simple volume metrics.
The indicator color-codes bars to reflect price movement: green bars indicate bullish or neutral candles where the close price is equal to or higher than the open price, while red bars signify bearish candles where the close price is lower than the open price.
Why it may be useful
By weighting volume against price, this indicator offers traders a more nuanced view of market participation and capital flow. It helps distinguish between significant trading activity and mere price fluctuations, providing deeper insights into market sentiment and potential trend strength.
The color-coding system allows traders to quickly assess market dynamics, enabling faster visual interpretation of buying and selling pressure across different timeframes and market conditions.
When to explore it
This volume indicator is most effective during periods of significant market movement, such as trend initiation, consolidation, or potential trend reversal. Traders can use it to confirm trend strength, identify potential entry and exit points, and assess the reliability of price movements.
It is particularly useful in volatile markets where understanding the relationship between price and volume can provide critical trading insights. The indicator can help traders distinguish between meaningful market movements and potential false signals.
Keep exploring
What we’ve verified
Access, alerts and repainting behaviour have not been independently verified for this indicator. Check the creator’s current publication and settings.
General descriptions and classifications are recovered research. Verified details above identify the specific checks we have completed. Check the creator’s current publication for later changes.


