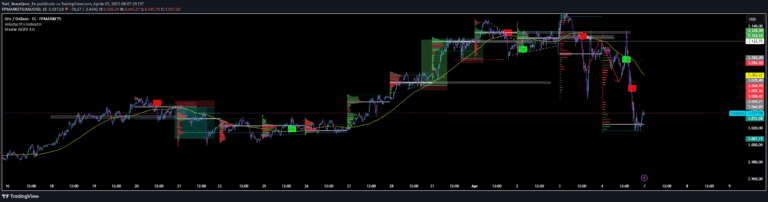
A volume indicator that calculates potential trading volume based on price fluctuations within a specified time period, helping traders analyze volume changes and price relationships.
Explore complementary indicator rolesHow it works
The indicator calculates potential volume by tracking the highest and lowest prices within a specified time period. It uses a set length (default 20 bars) to analyze price fluctuations and compares them with volume changes.
The calculation generates multiple visual elements, including blue and red lines for price extremes, a green line for potential volume, and an orange/purple step line for calculated volume changes. By sampling price and volume data at specified intervals, the indicator provides a detailed view of market dynamics.
Why it may be useful
This volume indicator offers traders a comprehensive view of market activity by connecting price movements with volume changes. It helps identify potential trend strength, market sentiment, and possible trading opportunities by revealing how volume correlates with price fluctuations.
By providing visual representations of volume dynamics, traders can gain insights into market momentum, detect potential trend reversals, and make more informed trading decisions. The multi-layered approach allows for a nuanced understanding of market behavior beyond simple price action.
When to explore it
The indicator performs best on shorter timeframes like 1-minute and 5-minute charts, where price and volume changes are more frequent and detailed. These smaller timeframes provide higher data density, allowing for more precise and immediate volume analysis.
Traders should use this indicator when seeking to understand the relationship between price movements and volume, particularly in fast-moving markets or when looking to confirm trend strength. It is especially useful for scalpers and day traders who require quick, granular market insights.
Keep exploring
What we’ve verified
Access, alerts and repainting behaviour have not been independently verified for this indicator. Check the creator’s current publication and settings.
General descriptions and classifications are recovered research. Verified details above identify the specific checks we have completed. Check the creator’s current publication for later changes.