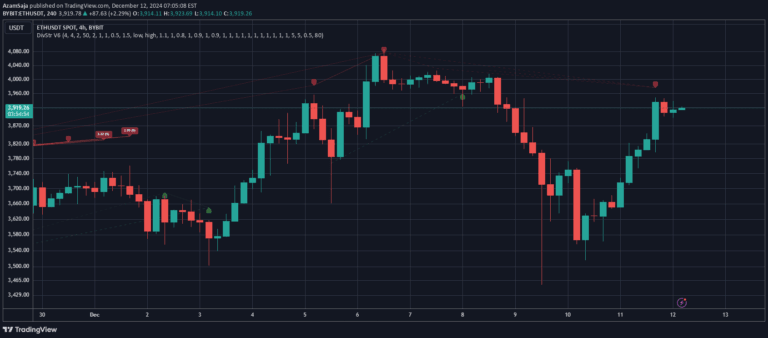
A comprehensive trading indicator combining Chaikin Oscillator, IMI, MACD, and Parabolic SAR to generate precise buy and sell signals with turning zone identification.
Explore complementary indicator rolesHow it works
The Vorse4 Indicator analyzes multiple technical indicators simultaneously to generate trading signals. It evaluates the Chaikin Oscillator for money flow, the Intraday Momentum Index for price movement strength, the MACD for trend direction, and the Parabolic SAR for potential trend reversals.
When all four indicators align, the system produces a clear buy or sell signal. Buy signals occur with a positive Chaikin Oscillator crossover, IMI above 50, MACD line crossing its signal line upwards, and price above Parabolic SAR. Conversely, sell signals happen with opposite conditions, providing traders with comprehensive market analysis.
Why it may be useful
The Vorse4 Indicator offers traders a multi-dimensional approach to market analysis by combining four powerful technical indicators into a single, comprehensive signal generator. This approach reduces individual indicator noise and provides more robust trading decisions by requiring confirmation from multiple analytical tools.
By integrating different technical analysis methods, the indicator helps traders identify potential trend changes, momentum shifts, and critical turning points in the market. The visual representation of signals and turning zones allows traders to quickly interpret complex market dynamics and make more informed trading decisions.
When to explore it
The Vorse4 Indicator is most effective in markets with clear trending or momentum-driven characteristics, such as stocks, forex, and cryptocurrency markets. It performs best in timeframes ranging from short-term (minutes) to medium-term (daily) charts, making it particularly useful for scalping and day trading strategies.
Traders should use this indicator in conjunction with other technical and fundamental analysis tools to confirm signals. It is particularly valuable during periods of market volatility, when multiple indicators can provide a more comprehensive view of potential price movements and trend reversals.
Keep exploring
What we’ve verified
Access, alerts and repainting behaviour have not been independently verified for this indicator. Check the creator’s current publication and settings.
General descriptions and classifications are recovered research. Verified details above identify the specific checks we have completed. Check the creator’s current publication for later changes.