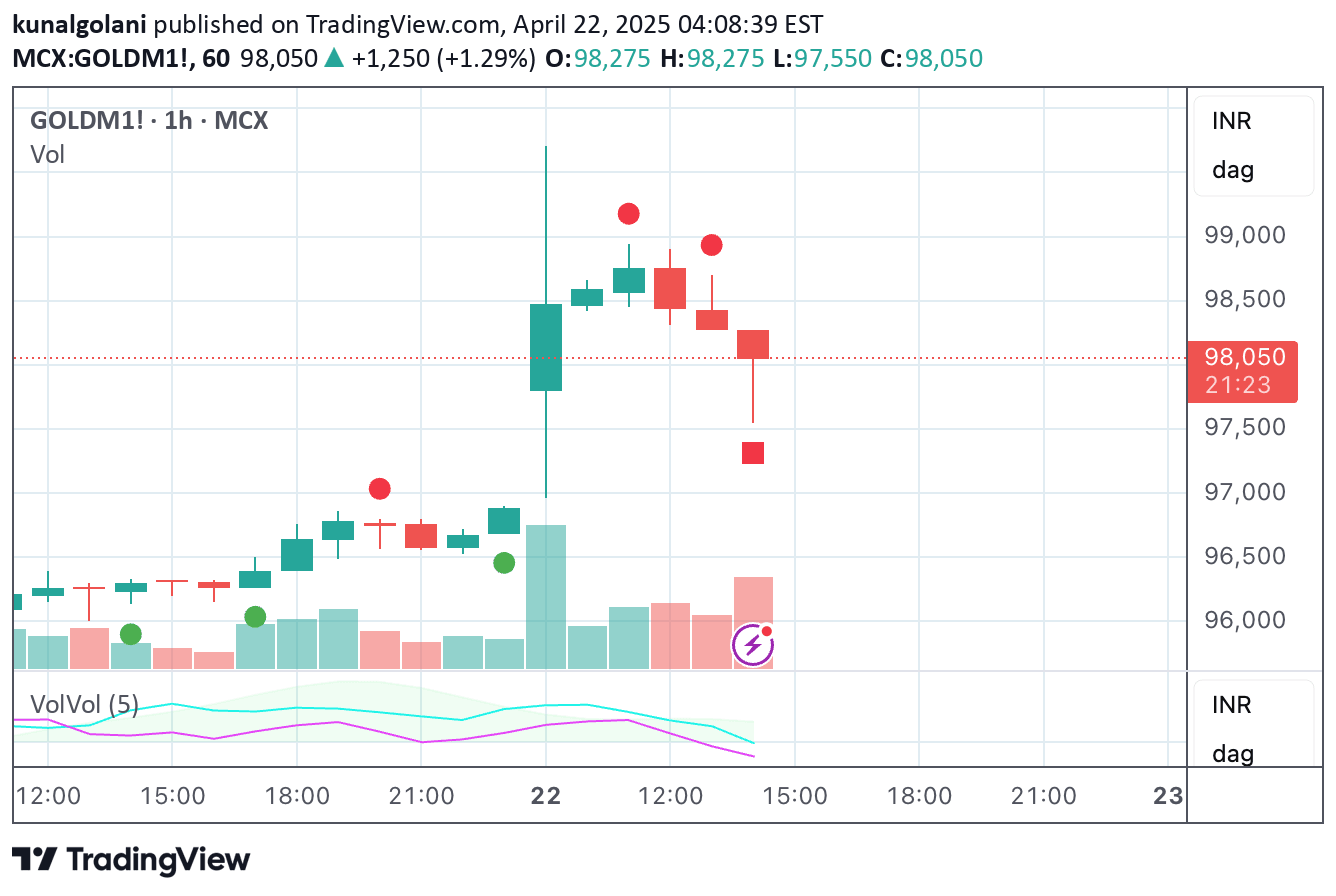
A volume-based trading indicator that combines Volume Spread Analysis with Fibonacci levels to identify key price zones and potential support/resistance areas dynamically.
Explore complementary indicator rolesHow it works
The indicator calculates volume levels based on selected timeframes, identifying high volume spikes and low volume dips that signal potential supply and demand shifts. It employs a simple moving average of volume to smooth fluctuations and create more reliable signals.
When a high-volume event is detected, the indicator records the highest high and lowest low of that specific candle. It then plots Fibonacci retracement and extension levels, including negative Fibonacci levels, to highlight potential price reaction zones and provide traders with comprehensive visual insights.
Why it may be useful
This indicator helps traders spot accumulation and distribution phases by analyzing volume dynamics at critical price points. It provides insights into market sentiment and potential trend movements by correlating volume behavior with price levels.
By integrating Volume Spread Analysis with Fibonacci techniques, traders can confirm trend strength, identify potential reversal points, and make more informed trading decisions across different market conditions and timeframes.
When to explore it
Use this indicator to confirm breakouts or potential reversals at key Fibonacci levels when volume supports the price movement. It is particularly effective when monitoring high-volume spikes near critical Fibonacci zones, which can signal strong trend continuation or potential trend changes.
The indicator works exceptionally well for trend-following strategies, scalping, and breakout trading, offering traders a comprehensive tool for analyzing market dynamics and making precise entry and exit decisions.
Keep exploring
What we’ve verified
Access, alerts and repainting behaviour have not been independently verified for this indicator. Check the creator’s current publication and settings.
General descriptions and classifications are recovered research. Verified details above identify the specific checks we have completed. Check the creator’s current publication for later changes.