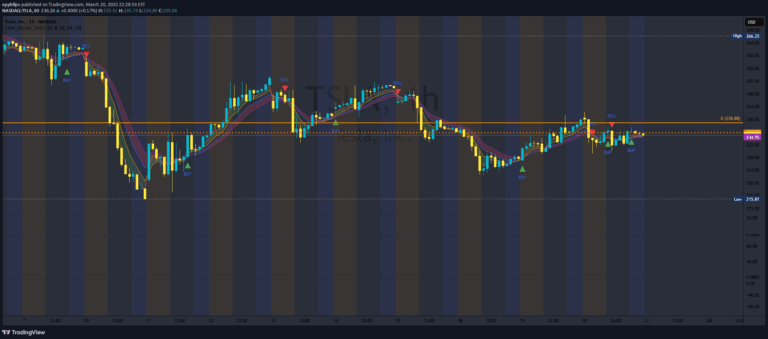
A powerful trading indicator combining Volume Weighted Average Price (VWAP) with Relative Strength Index (RSI) to analyze market trends, momentum, and potential entry/exit points.
Explore complementary indicator rolesHow it works
The VWAP with RSI Indicator integrates two distinct analytical methods to provide comprehensive market insights. The Volume Weighted Average Price (VWAP) calculates the average price based on trading volume, creating a dynamic reference line that reflects the true market price.
Simultaneously, the Relative Strength Index (RSI) measures price momentum by tracking average gains and losses over a specified period. It generates values between 0 and 100, with levels above 70 indicating overbought conditions and below 30 signaling oversold scenarios, helping traders identify potential trend reversals and market sentiment.
Why it may be useful
By combining volume-weighted pricing with momentum analysis, this indicator offers traders a more nuanced view of market dynamics than traditional single-metric approaches. It provides a comprehensive framework for understanding price trends, volume influence, and potential market turning points, enabling more informed trading decisions.
The dual-indicator approach allows traders to simultaneously assess price movement, volume context, and momentum strength. This multifaceted analysis reduces the risk of making trading decisions based on incomplete information, ultimately enhancing a trader's ability to identify high-probability trading opportunities across different market conditions.
When to explore it
The VWAP with RSI Indicator is most effective in markets with clear trending or ranging conditions, particularly during periods of moderate to high trading volume. It performs exceptionally well in liquid markets like major stock indices, forex pairs, and heavily traded commodities where volume data provides meaningful insights.
Traders should leverage this indicator during key market sessions, such as opening hours or periods of significant economic announcements. It is particularly valuable when seeking to confirm trend strength, identify potential reversal points, and manage entry and exit strategies across various timeframes from scalping to swing trading.
Keep exploring
What we’ve verified
Access, alerts and repainting behaviour have not been independently verified for this indicator. Check the creator’s current publication and settings.
General descriptions and classifications are recovered research. Verified details above identify the specific checks we have completed. Check the creator’s current publication for later changes.