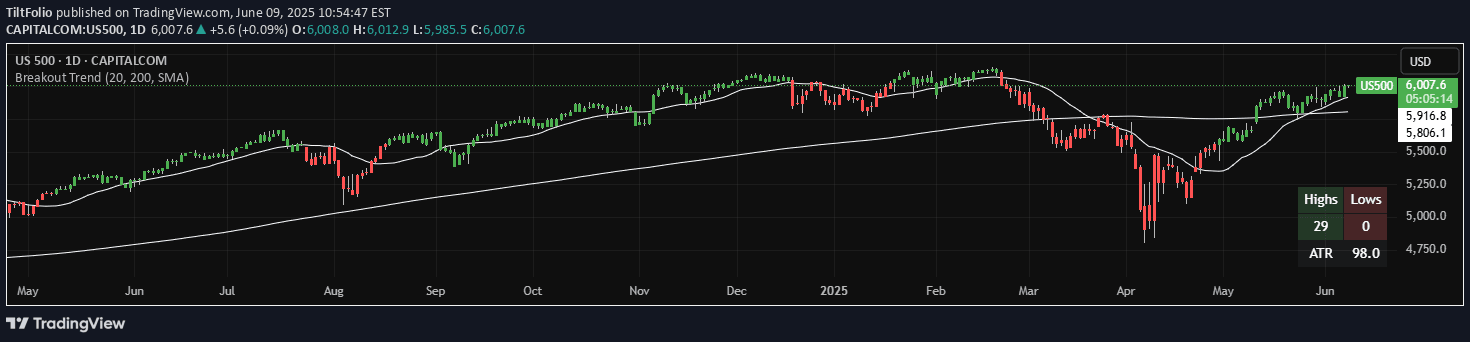
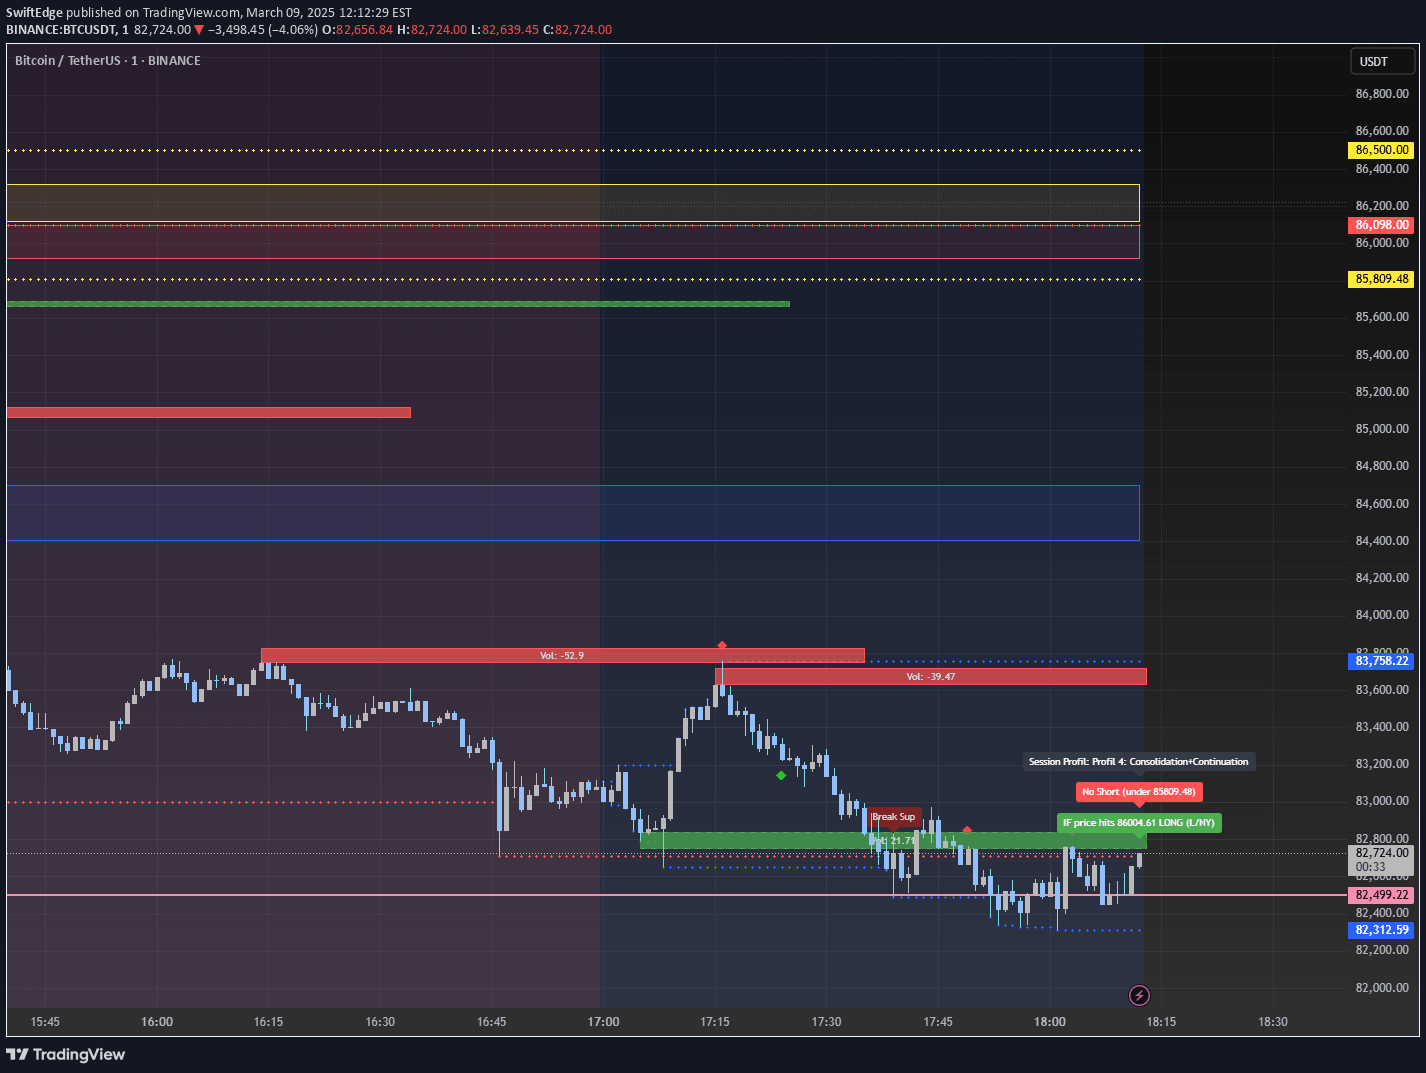
A technical analysis tool that identifies potential market breakouts by detecting price movements within converging trendlines, signaling possible bullish or bearish trend reversals.
Explore complementary indicator rolesHow it works
The Wedge Breakout indicator operates by first identifying critical pivot points that define the upper and lower boundaries of a wedge pattern. It calculates these points by analyzing the highest and lowest price levels over a specified timeframe, creating converging trendlines that represent the wedge's structure.
Once the trendlines are established, the indicator monitors price action to detect potential breakouts. It specifically looks for moments when the price exceeds both the upper and lower trendlines, which suggests a significant price movement is imminent. The breakout's direction is then determined by comparing the candle's opening and closing prices.
Why it may be useful
The Wedge Breakout indicator is crucial for traders because it provides a systematic approach to identifying potential trend reversals in volatile markets. By visualizing price compression within converging trendlines, traders can anticipate and prepare for significant price movements before they occur, giving them a strategic advantage in timing their entries and exits.
Moreover, the indicator offers clear visual signals through color-coded triangles, making it easier for traders to quickly interpret market conditions. The green and red triangles help traders distinguish between bullish and bearish breakouts, reducing the complexity of technical analysis and enabling more intuitive decision-making.
When to explore it
The Wedge Breakout indicator is most effective in markets experiencing consolidation or range-bound trading, where prices are moving within increasingly narrow boundaries. Traders should pay particular attention to this signal during periods of low volatility, as these conditions often precede significant price movements in either direction.
The indicator is especially valuable in cryptocurrency, forex, and stock markets with high liquidity and frequent price fluctuations. Traders should combine this tool with other technical indicators and fundamental analysis to confirm signals and improve overall trading strategy reliability.
Keep exploring
What we’ve verified
Access, alerts and repainting behaviour have not been independently verified for this indicator. Check the creator’s current publication and settings.
General descriptions and classifications are recovered research. Verified details above identify the specific checks we have completed. Check the creator’s current publication for later changes.