
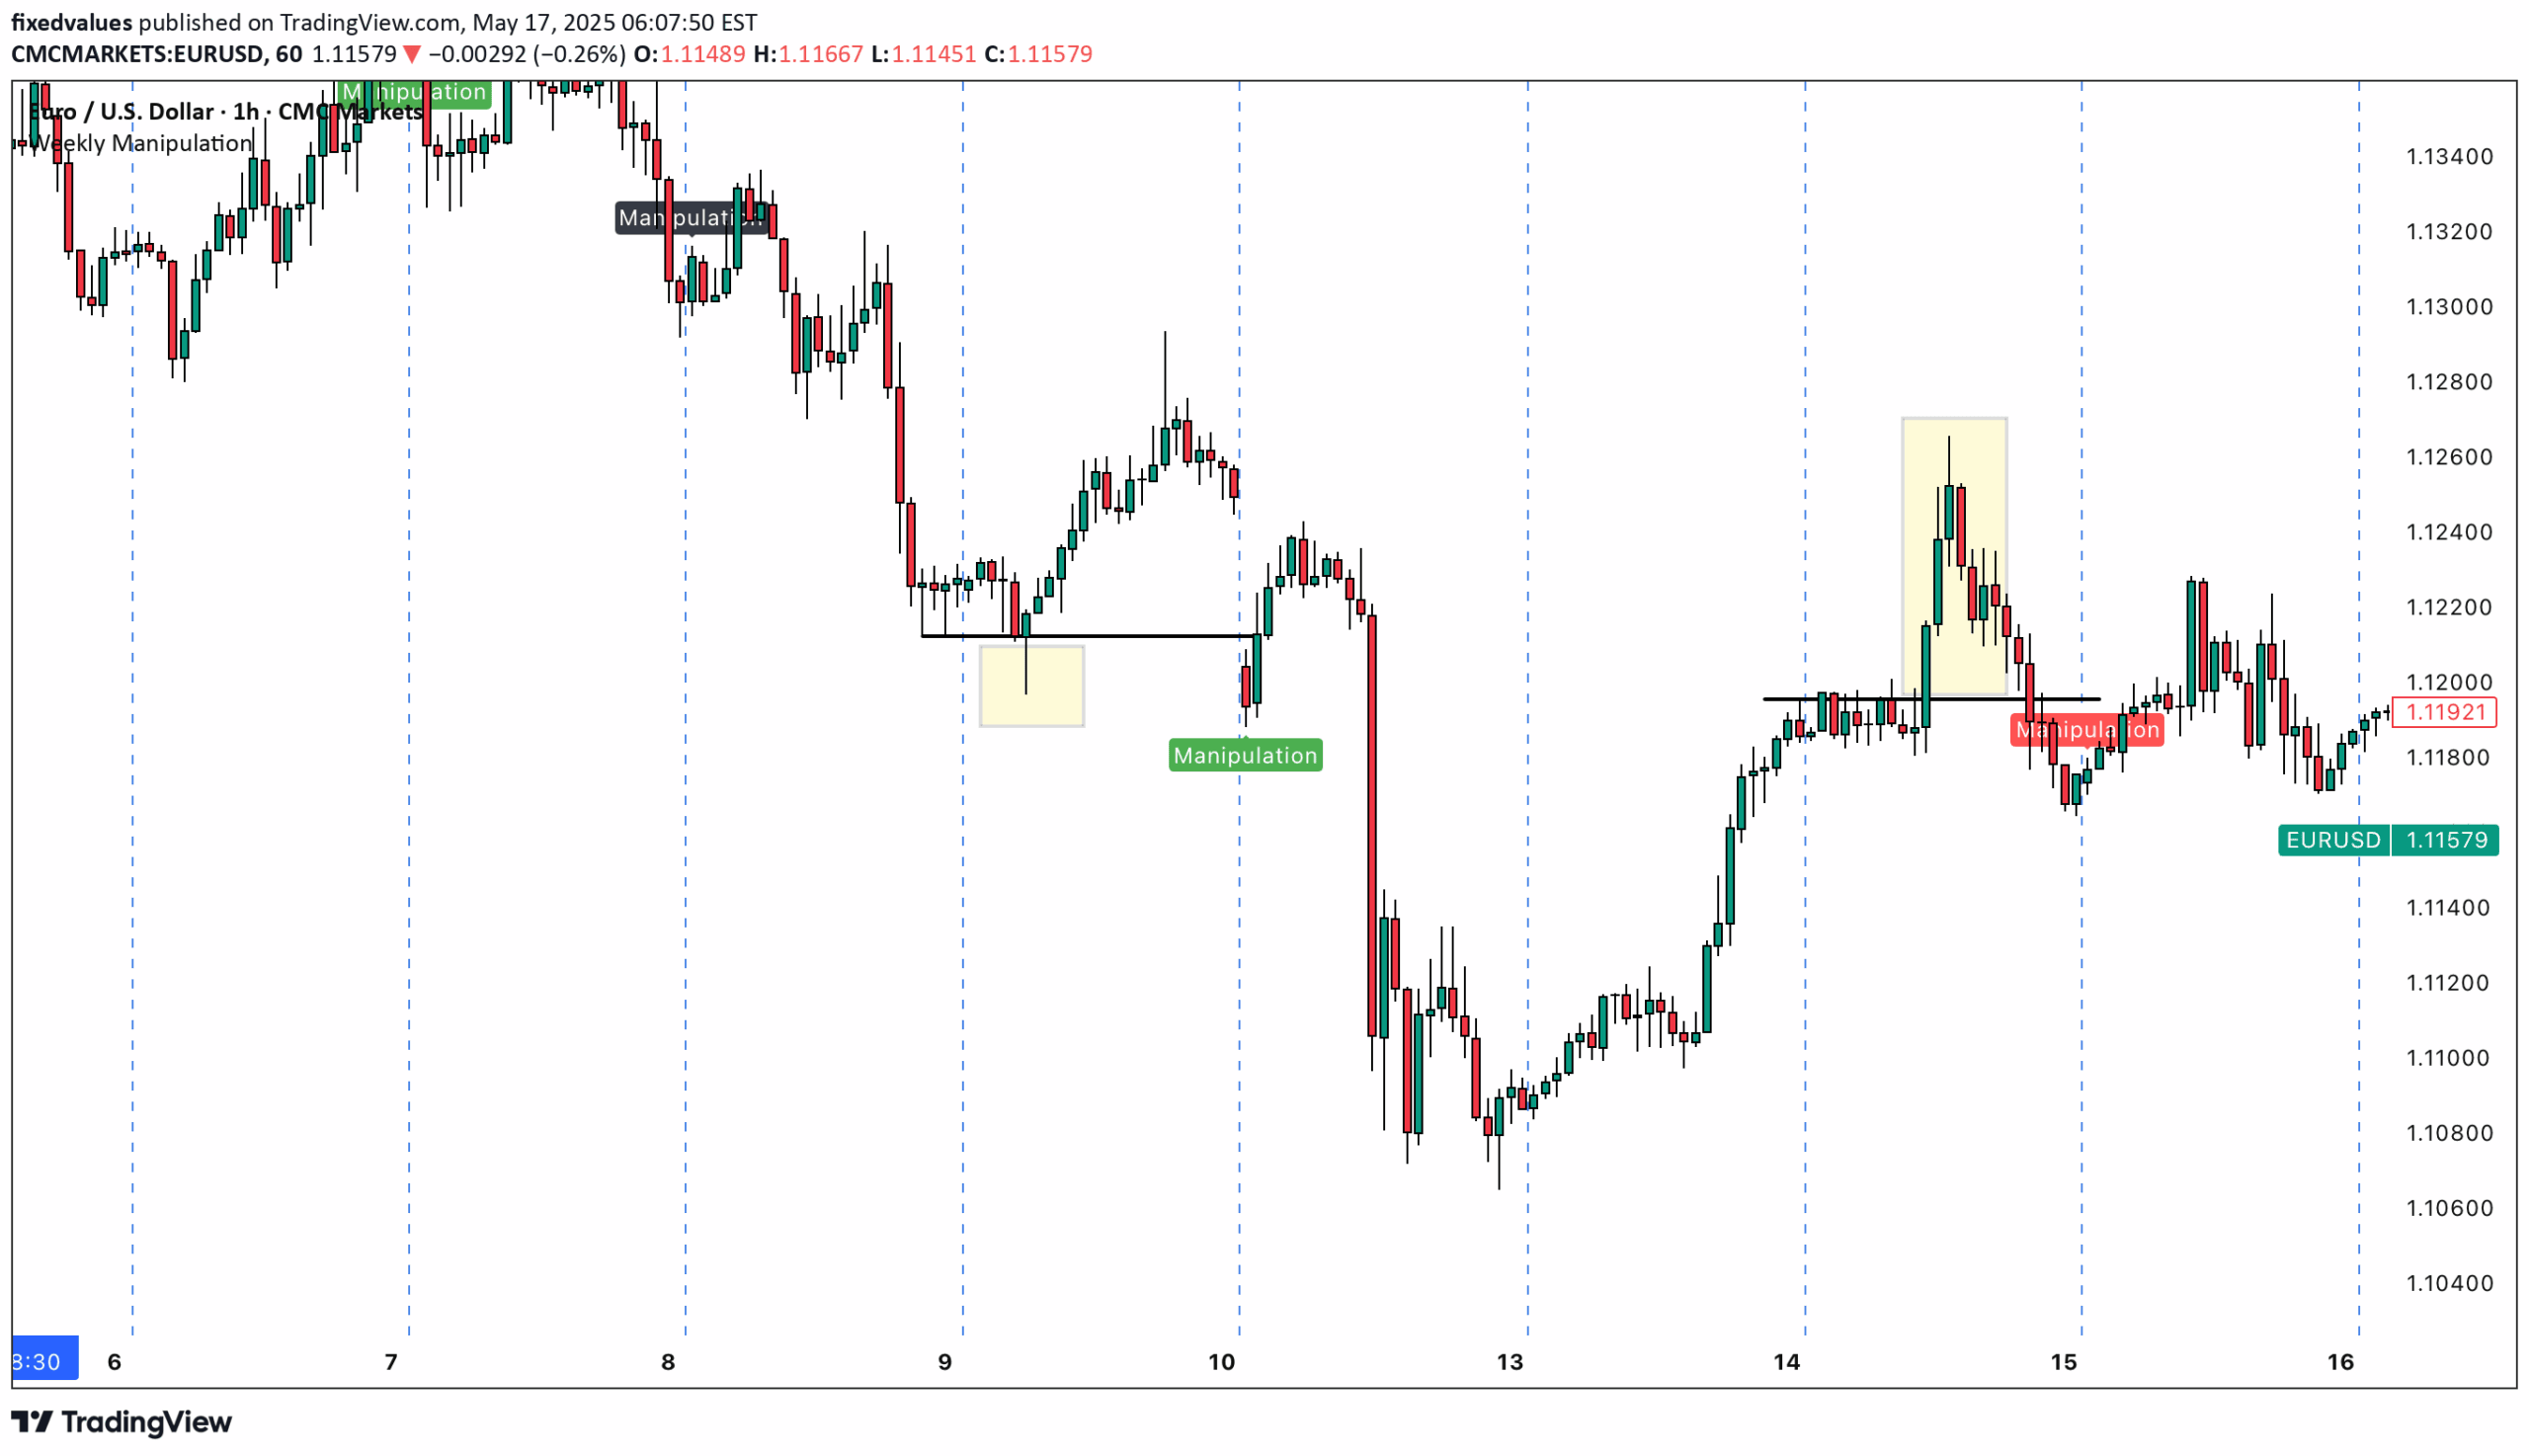
A trading indicator that identifies false breakouts and potential market manipulation through single and two-day price action patterns that signal potential trend reversals.
Explore complementary indicator rolesHow it works
The Weekly Manipulation indicator detects market manipulation by tracking specific price action patterns across single and two-day periods. For single-day manipulation, it identifies bearish scenarios where price breaks above the previous day's high but fails to maintain momentum, closing below that high, and bullish scenarios where price drops below the previous day's low but reverses and closes above that low.
Two-day manipulation patterns provide a more complex view of potential market manipulation, offering deeper insights into potential trend reversals. These black-labeled signals represent more nuanced price movements that might indicate stronger manipulation attempts and more powerful potential trend changes.
Why it may be useful
Market manipulation can often trap traders into making poor decisions based on false breakouts and misleading price movements. By identifying these manipulation patterns, traders can develop a more sophisticated understanding of market dynamics and avoid entering trades based on deceptive price action.
The indicator provides critical insights into market psychology, helping traders recognize when price movements might not represent genuine market sentiment. This understanding can significantly improve trading decision-making by highlighting potential false signals and offering more reliable entry and exit points.
When to explore it
The Weekly Manipulation indicator is most effective in markets with significant institutional activity and during periods of high volatility. Traders should pay special attention to these signals during key technical levels, such as support and resistance zones, where manipulation attempts are more likely to occur.
This indicator works best when combined with other technical analysis tools and used across multiple timeframes. Traders should look for confluence with other indicators and consider the broader market context to validate the manipulation signals and make more informed trading decisions.
Keep exploring
What we’ve verified
Access, alerts and repainting behaviour have not been independently verified for this indicator. Check the creator’s current publication and settings.
General descriptions and classifications are recovered research. Verified details above identify the specific checks we have completed. Check the creator’s current publication for later changes.


