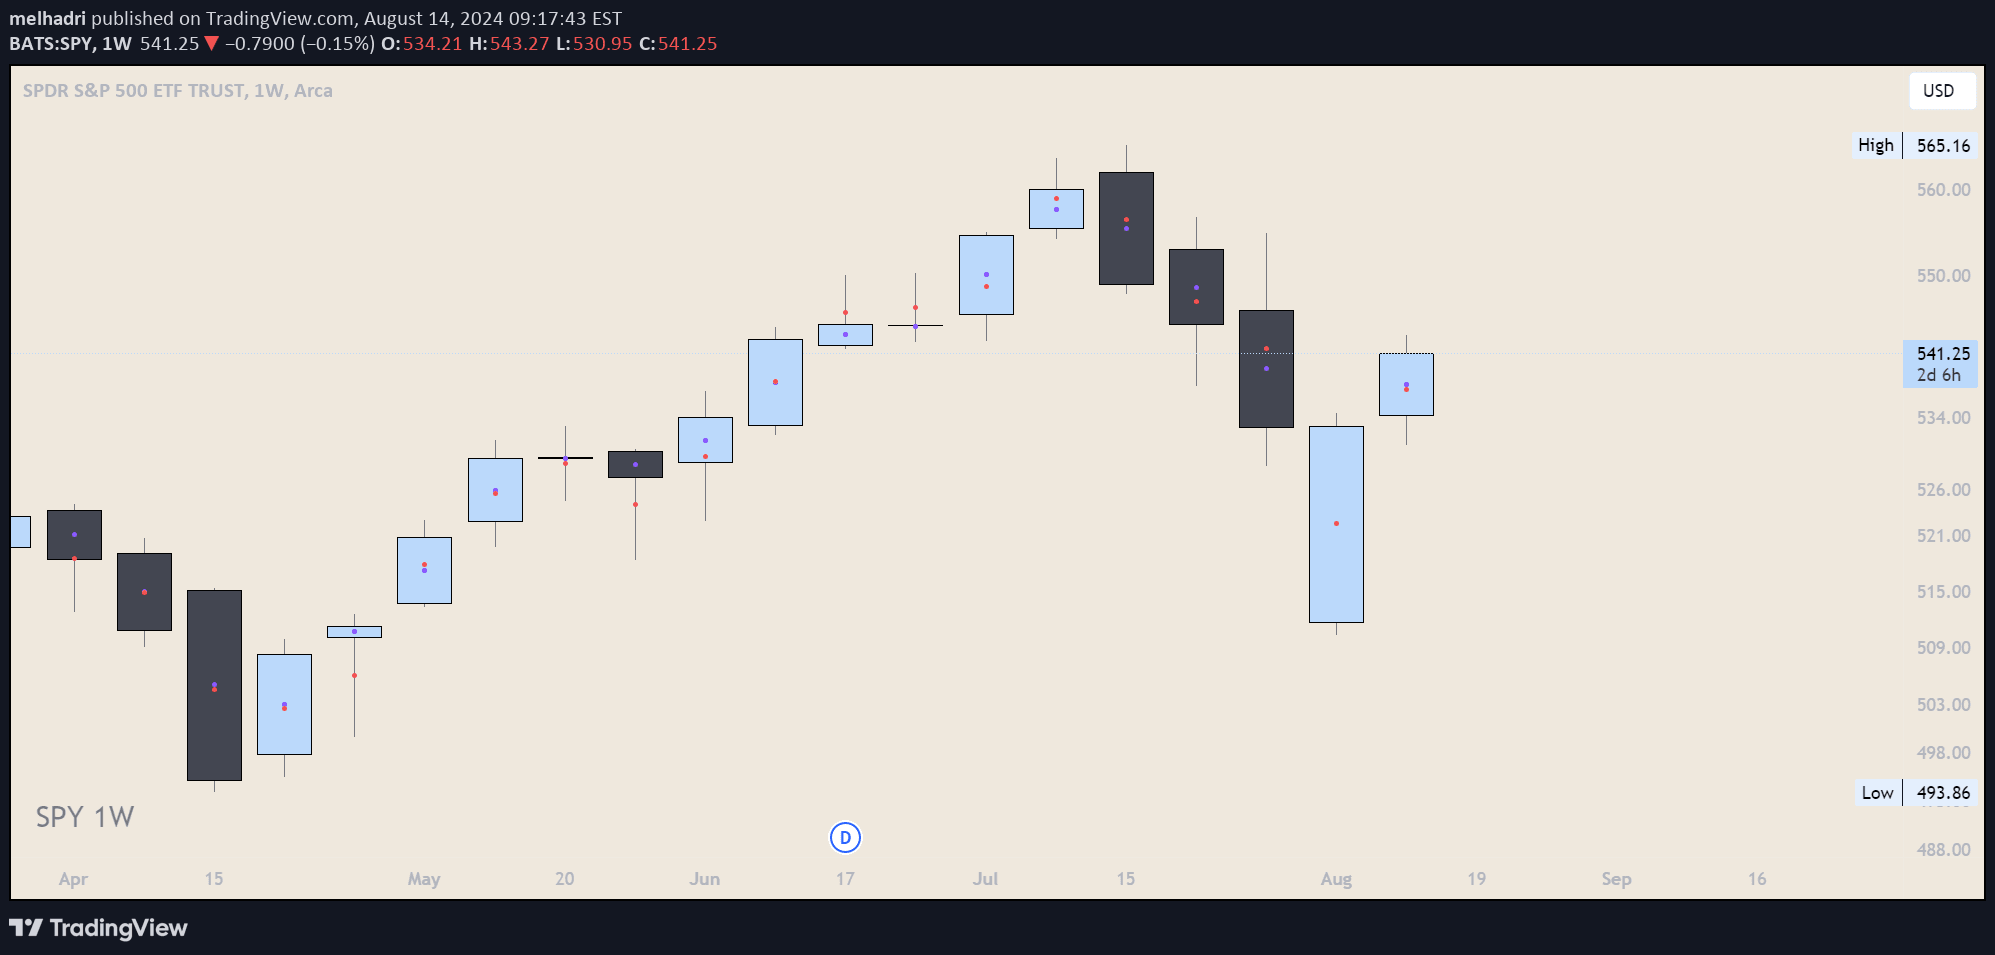
A trading tool that identifies and plots the midpoint line of a wick or tail, highlighting potentially sensitive price levels for technical analysis and trading decisions.
Explore complementary indicator rolesHow it works
The Wick Consequent Encroachment (CE) tool analyzes price action by identifying the precise midpoint of a wick or tail on historical price candles. Traders can customize the number of consecutive bars to analyze and how far forward to extend the identified levels, creating horizontal reference lines.
By calculating the exact midpoint of price wicks, the tool provides a systematic method for marking potentially significant price zones. It eliminates manual measurement and allows traders to quickly visualize key levels without extensive manual drawing or fibonacci retracement calculations.
Why it may be useful
The Wick CE tool offers traders a precise method for identifying potential support and resistance levels based on price action dynamics. By focusing on the midpoint of wicks, traders can gain insights into market sentiment and potential price reversal zones.
This approach provides a structured way to analyze price behavior, helping traders make more informed decisions about market entry and exit points. The tool's flexibility in customizing historical and forward projection allows for adaptable technical analysis across different trading styles and market conditions.
When to explore it
The Wick CE tool is most effective in markets with clear price action and distinct wick formations, such as forex, futures, and liquid stock markets. Traders can use this tool during periods of consolidation or when looking for potential reversal zones in trending and ranging markets.
It is particularly useful for short-term traders who want to identify precise levels quickly and systematically. The tool works best when combined with other technical analysis methods and should be used as part of a comprehensive trading strategy that includes risk management and additional confirmation signals.
Keep exploring
What we’ve verified
Access, alerts and repainting behaviour have not been independently verified for this indicator. Check the creator’s current publication and settings.
General descriptions and classifications are recovered research. Verified details above identify the specific checks we have completed. Check the creator’s current publication for later changes.