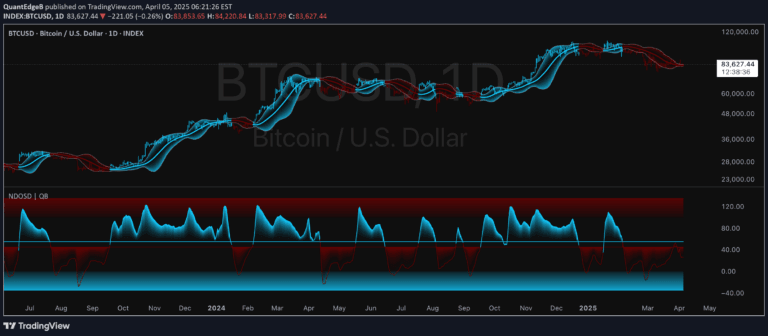
The Z-Score indicator measures price deviation from historical mean, helping traders identify potential overbought and oversold market conditions using statistical analysis.
Explore complementary indicator rolesHow it works
The Z-Score indicator calculates the statistical relationship between current price and its historical average by measuring standard deviations. It first computes the mean price over a specified lookback period, typically 20 periods, using a chosen price source like closing prices.
After establishing the mean, the indicator determines the standard deviation of prices during that period. The Z-Score is then calculated by subtracting the mean from the current price and dividing by the standard deviation, revealing how far the current price deviates from its historical norm.
Why it may be useful
The Z-Score provides traders with a sophisticated statistical method to evaluate price extremes and potential market reversals. By quantifying price movements relative to historical performance, it offers an objective approach to identifying potential overbought and oversold conditions beyond subjective visual analysis.
This indicator helps traders make more informed decisions by transforming raw price data into a standardized metric that reveals significant price deviations. It enables traders to assess market conditions with greater precision, potentially highlighting opportunities that might be missed by traditional technical analysis methods.
When to explore it
The Z-Score indicator works best in markets with clear trending or ranging characteristics, where price movements demonstrate consistent statistical patterns. It is particularly effective in liquid markets with sufficient historical data to establish reliable statistical baselines, such as major stock indices, forex pairs, and actively traded commodities.
Traders should use the Z-Score in conjunction with other technical indicators to confirm signals and validate potential trade entries or exits. It is most powerful when combined with momentum oscillators, trend-following indicators, and volume analysis to provide a comprehensive market assessment.
Keep exploring
What we’ve verified
Access, alerts and repainting behaviour have not been independently verified for this indicator. Check the creator’s current publication and settings.
General descriptions and classifications are recovered research. Verified details above identify the specific checks we have completed. Check the creator’s current publication for later changes.