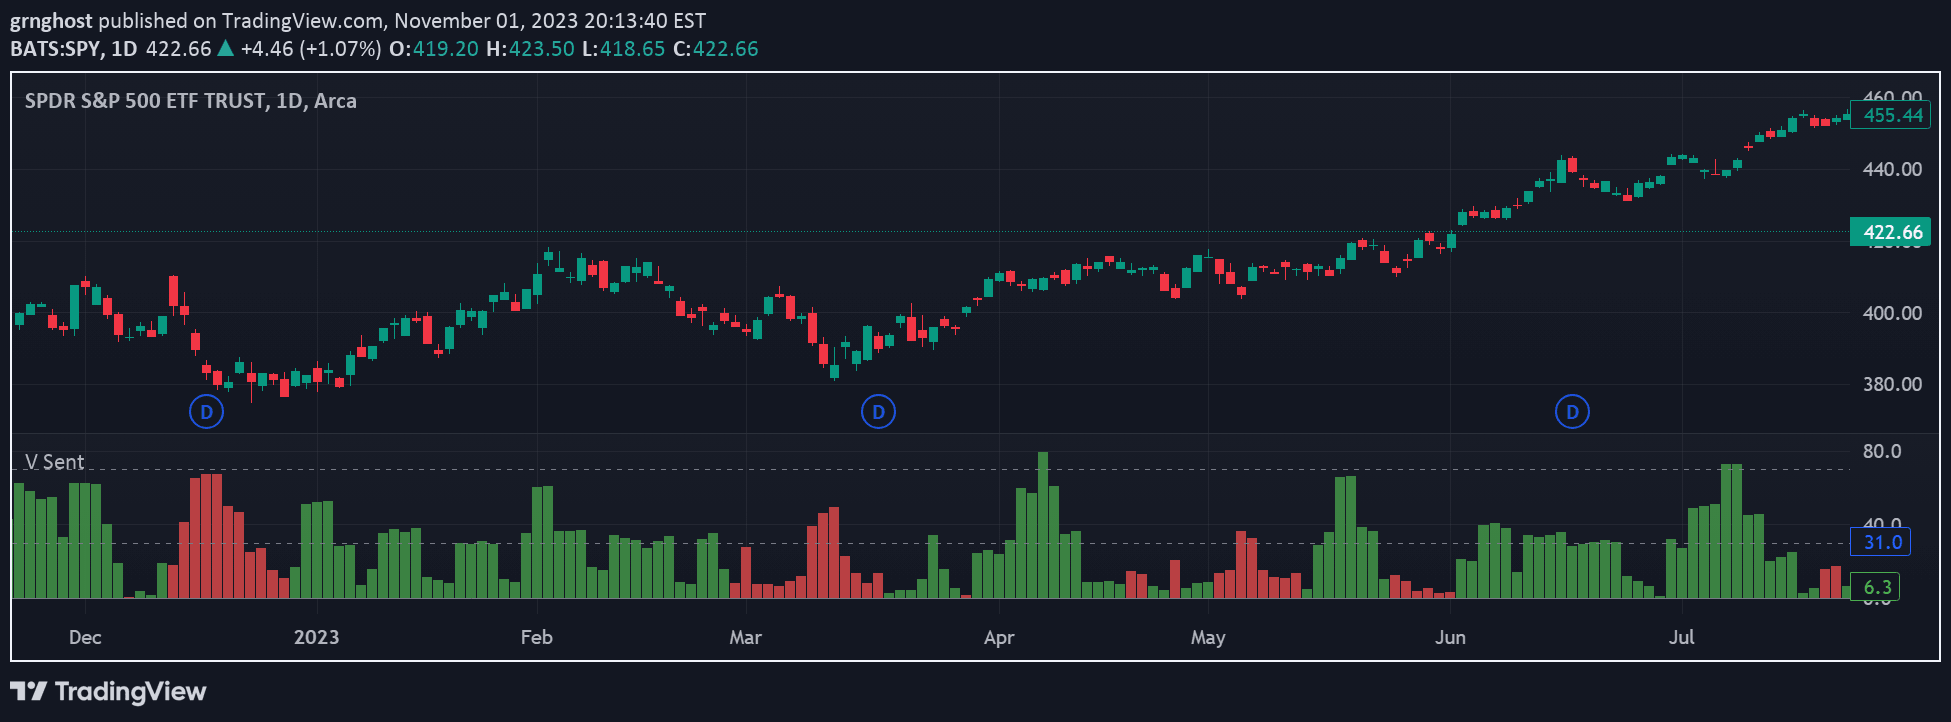
A volume-based Z-score indicator that identifies significant trading volume spikes and potential buying opportunities by analyzing volume deviation from its historical average.
Explore complementary indicator rolesHow it works
The indicator calculates the Z-score of trading volume by comparing the current volume to its historical average and standard deviation over a specified period. It uses a Rate of Change (ROC) calculation on the source price to measure price momentum alongside volume analysis.
When the volume Z-score exceeds a predefined threshold, the indicator triggers specific conditions to identify potential trading signals. These conditions include checking for bearish candles and significant downward price movement, which helps traders pinpoint potentially meaningful market moments.
Why it may be useful
Volume analysis provides critical insights into market sentiment and potential price movements by revealing the strength behind price changes. This Z-score approach allows traders to quantitatively assess when trading volume deviates significantly from normal patterns, which can signal important market transitions.
By highlighting volume anomalies, the indicator helps traders identify potential entry points and understand underlying market dynamics. It transforms raw volume data into a statistically meaningful signal that can complement other technical analysis tools.
When to explore it
The indicator performs best on shorter timeframes like 3-minute and 5-minute charts, where volume fluctuations can be more revealing of immediate market sentiment. It is particularly useful for traders seeking to identify potential buying opportunities during periods of unusual trading volume.
Traders should pay special attention when signals appear on multiple timeframes, as confirmation across different chart periods can increase the reliability of the trading signal. The indicator is specifically designed for buy signals and works most effectively when combined with other technical analysis methods.
Keep exploring
What we’ve verified
Access, alerts and repainting behaviour have not been independently verified for this indicator. Check the creator’s current publication and settings.
General descriptions and classifications are recovered research. Verified details above identify the specific checks we have completed. Check the creator’s current publication for later changes.