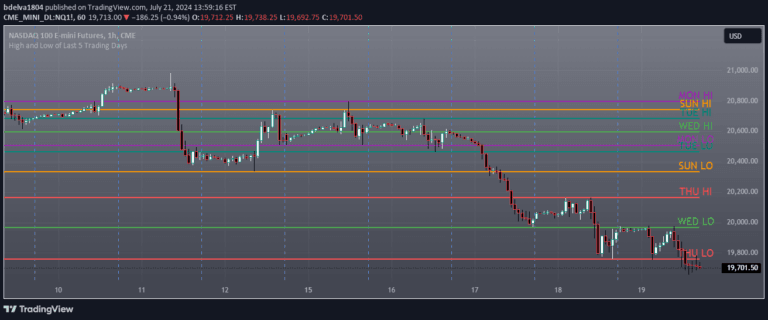
Chart previewSignalLevelsHigh and Low of Last 5 Trading Daysby bdelva1804A visual tool that plots high and low price levels from the last 5 trading days, helping traders identify key support and resistance zones across recent market action.Main price chart · unverifiedScalping · Day TradingExplore 107likes2.7Kviews3commentsCompareSave