
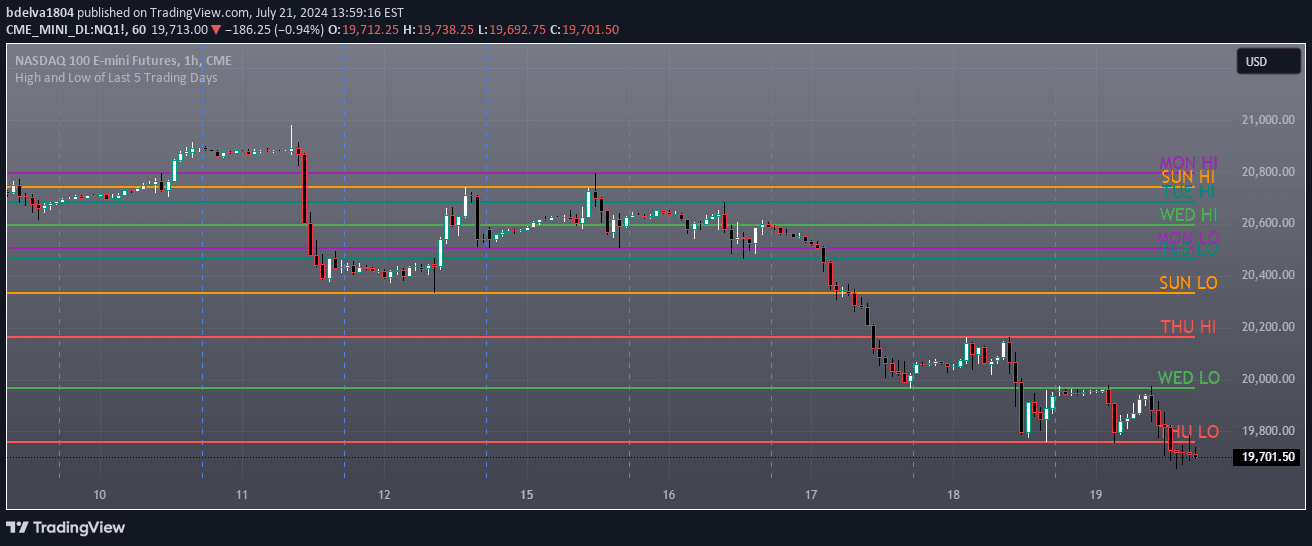
A visual tool that plots high and low price levels from the last 5 trading days, helping traders identify key support and resistance zones across recent market action.
Explore complementary indicator rolesHow it works
The indicator automatically tracks and plots the highest and lowest price points for each of the past 5 trading days directly on the price chart. It creates color-coded solid lines representing these daily extreme levels, with unique colors for easy visual differentiation.
Each line is labeled with the corresponding day and whether it represents a high or low price point. The lines are dynamically updated at the start of each new trading day, ensuring traders always have the most recent price context.
Why it may be useful
This indicator provides traders with an immediate visual representation of recent price dynamics, helping them quickly understand market sentiment and potential support/resistance zones. By highlighting the exact high and low points of recent trading sessions, it offers insight into where significant price interactions have occurred.
Traders can use these levels to make more informed decisions about potential entry and exit points, understanding the recent price context and psychological levels that might influence future market movements.
When to explore it
The indicator is most effective in markets with clear short-term price trends and defined support/resistance levels. It works particularly well for traders seeking to understand recent price action and identify potential trading opportunities based on recent market behavior.
Traders can leverage this tool across various timeframes, from scalping to swing trading, to gain quick insights into recent price extremes and potential market turning points.
Keep exploring
What we’ve verified
Access, alerts and repainting behaviour have not been independently verified for this indicator. Check the creator’s current publication and settings.
General descriptions and classifications are recovered research. Verified details above identify the specific checks we have completed. Check the creator’s current publication for later changes.


