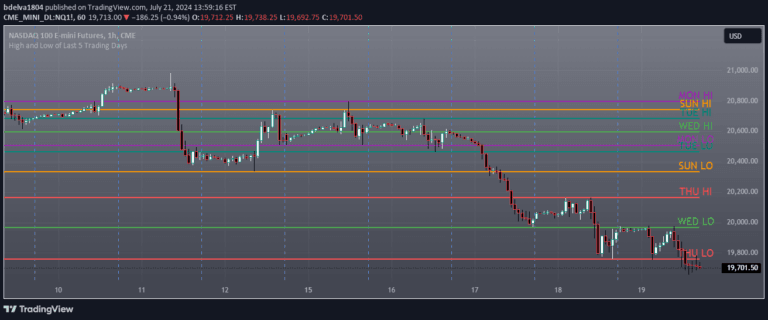
A trading tool that marks the first monthly candle's high and low levels to identify critical support and resistance zones for potential market liquidity and institutional behavior.
Explore complementary indicator rolesHow it works
The script identifies and plots the high and low levels of the first candle of each trading month directly on the price chart. These levels are dynamically marked, creating visual reference points that highlight potential key liquidity zones where significant market reactions might occur.
By tracking these monthly candle extremes, traders can observe how price interacts with these critical levels over time. The tool allows for customizable line colors and lengths, enabling traders to adapt the visualization to their specific trading style and preferences.
Why it may be useful
These monthly candle levels provide insights into potential institutional market behaviors and liquidity zones that might not be immediately apparent. By understanding where key support and resistance levels are located, traders can make more informed decisions about potential market movements and potential manipulation attempts.
The indicator helps traders identify critical price levels that could represent significant psychological or institutional trading zones. This approach allows for a more nuanced understanding of market dynamics, potentially revealing hidden market structures and trading opportunities.
When to explore it
This tool is most effective in markets with clear trending or consolidating behavior, where monthly candle levels can provide meaningful insights into potential support and resistance zones. It works particularly well in markets where institutional trading activities are prominent and liquidity is a key consideration.
Traders should consider using this indicator when seeking to understand longer-term market structures, manage risk more effectively, and align their trading strategies with potential institutional market behaviors. It is especially useful for swing traders and those interested in understanding broader market dynamics beyond short-term price movements.
Keep exploring
What we’ve verified
Access, alerts and repainting behaviour have not been independently verified for this indicator. Check the creator’s current publication and settings.
General descriptions and classifications are recovered research. Verified details above identify the specific checks we have completed. Check the creator’s current publication for later changes.